Cluster analysis in SPSS Assignment
Questions 5,6 and 7 make use of information collected through the HP customer satisfaction survey discussed in class.
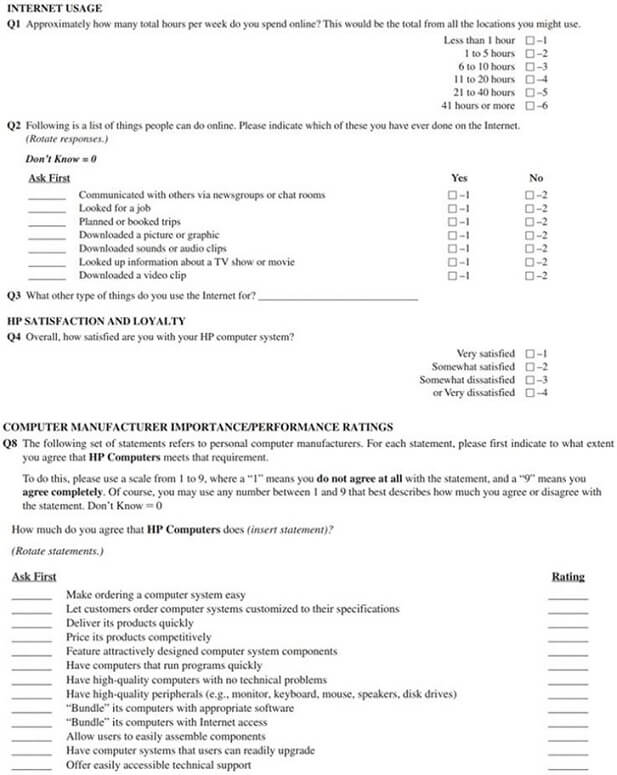
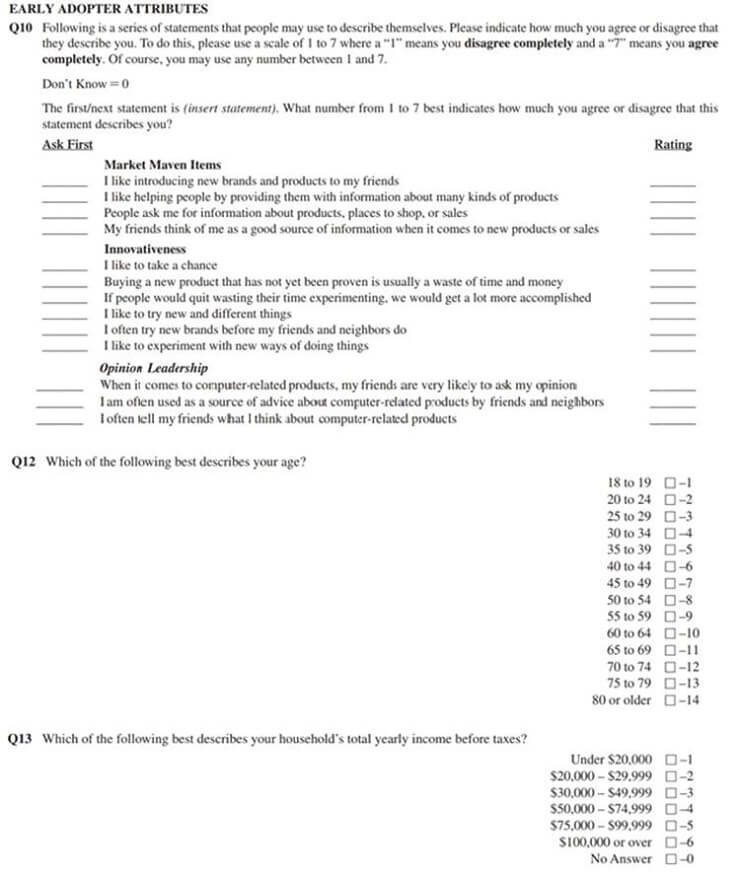
Question 5.
The survey collects information on customers’ early adopter attributes such as “market maven items” (Q10_1 to Q10_4). A researcher uses these four variables to find customer segments using two-step cluster analysis. The SPSS test results for the cluster analysis are provided below. Please answer the following questions based on the SPSS output.
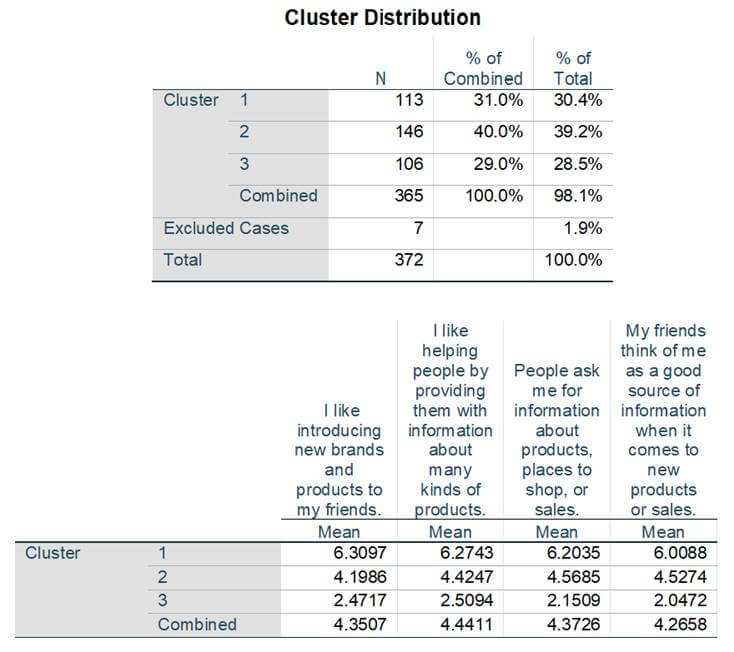
a) State the number of clusters found and their relative size distributions.
b) Describe the segments based on the cluster means for the three “market maven items” variables. How would you name these segments?
Question 6.
The survey also collects information on customers’ overall satisfaction level (Q4). Note that higher numbers for this survey question correspond to higher levels of dissatisfaction. The researcher conducts an ANOVA test comparing average customer satisfaction between individuals with low-, medium- and high-income individuals. The cutoffs for low-, medium-and high-income customers are incomes below $30,000 (denoted as “1”), incomes between $30,000 -$75,000 (denoted as “2”) and incomes above $75,000 (denoted as “3”) based on the choices in Q13. The following statistical output was produced by the researcher. Please answer the following questions.
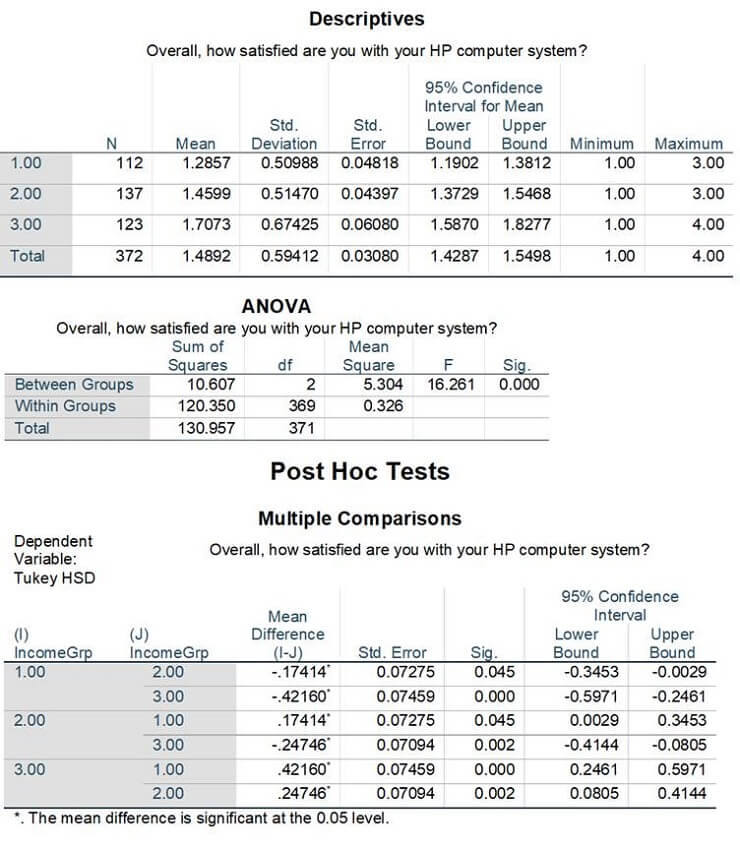
a) State the null and alternative hypothesis for the SPSS output above.
b) Provide an analysis of the SPSS output. If you reject the null hypothesis and find significant differences across these groups, mention which means are different and describe this difference.
Question 7.
The researcher has developed a linear regression model to understand drivers of customer satisfaction (Q4). Note that higher numbers for this survey question correspond to higher levels of dissatisfaction. The estimated model is:
Y = b0 + b1X1+ b2X2+ b3X3 + b4X4+ b5X5
where,
Y = overall customer satisfaction (Q4),
X1 = satisfaction towards customization of computer systems (Q8_2 - “And how much do you agree that HP lets customers order computer systems customized to their specifications” ),
X2 = satisfaction towards attractively designed components (Q8_5 – “And how much do you agree that HP features attractively designed computer system components”) ,
X3 = satisfaction towards high-quality peripherals (Q8_8 - “And how much do you agree that HP Computers have high-quality peripherals” )
X4 = satisfaction towards easy assembly of components (Q8_11 - “And how much do you agree that HP Computers allows users to easily assemble components” )
X5 = “old” dummy variable whether customer is above the age of 60 or below ( old_dummy, ages 60+ are recoded as 1 and <60 as 0 based on Q12)
The following SPSS output was produced by the lecturer. Please answer the following questions.
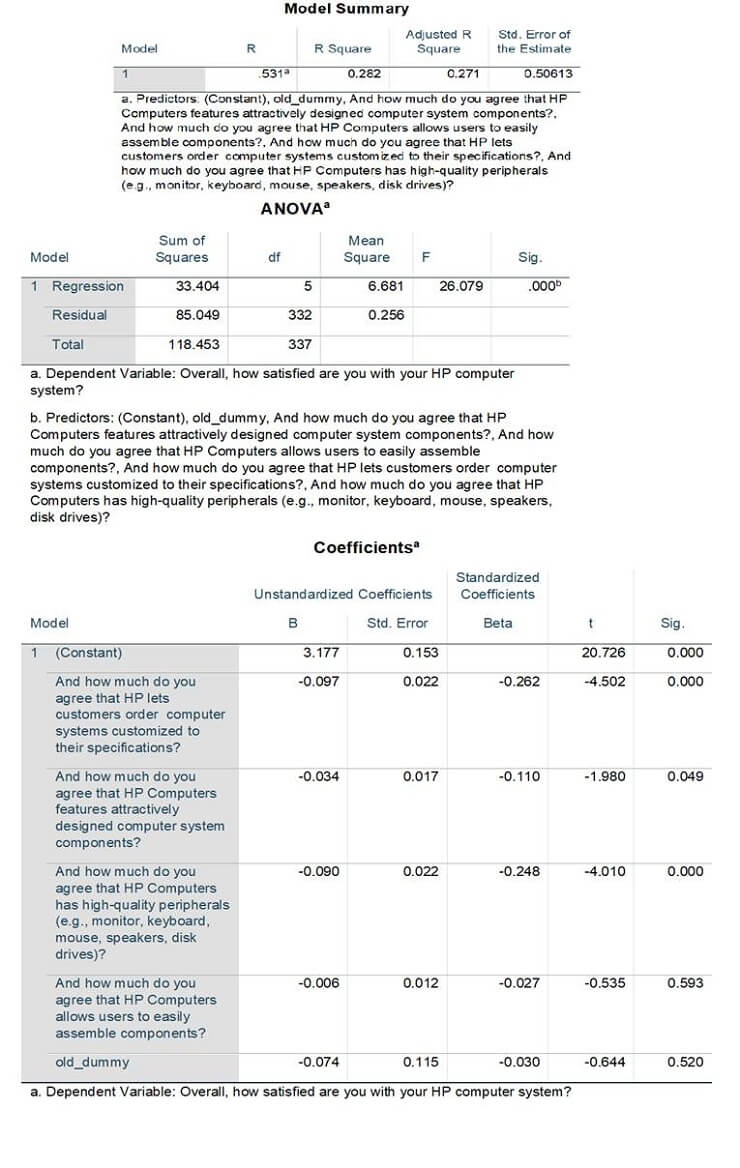
a) Interpret the R-square of the model from the Model Summary table. What does it represent?
b) Interpret the outcome of the F-test (mentioned in the ANOVA table in the output above). What are the null and alternate hypotheses of this test?
c) Interpret each coefficient (i.e. b1 to b5): write the null and alternative hypotheses for each test, explain the outcomes of these hypothesis tests and if necessary, the size of the Independent Variable’s effect on the Dependent Variable.
d) The researcher concludes that because all the individual coefficient magnitudes are less than 0.1, the regression model indicates a weak association. Do you agree with the researcher? Briefly explain why.

