STAT 220 Business Statistics
Using Excel pivot we got the following output
|
Column Labels | ||||||
|
1 |
2 |
Total Count of ID number |
Total Sum of Satisfaction | |||
|
Row Labels |
Count of ID number |
Sum of Satisfaction |
Count of ID number |
Sum of Satisfaction | ||
|
1 |
40 |
82 |
33 |
66 |
73 |
148 |
|
2 |
21 |
39 |
31 |
50 |
52 |
89 |
|
3 |
18 |
34 |
18 |
32 |
36 |
66 |
|
4 |
39 |
81 |
25 |
58 |
64 |
139 |
|
5 |
13 |
29 |
15 |
34 |
28 |
63 |
|
Grand Total |
131 |
265 |
122 |
240 |
253 |
505 |
Modification of the data is tabulated as follows
|
Category |
Male |
Female |
|
Accounting |
33 |
40 |
|
Finance |
31 |
21 |
|
General Management |
18 |
18 |
|
Marketing/Sales |
25 |
39 |
|
Other |
15 |
13 |
- Use Excel to draw cluster bar graph of reasons of unemployment male and female
Step 1 : Select the column of category, male and female
Step 2: Select Column > 2D-Column
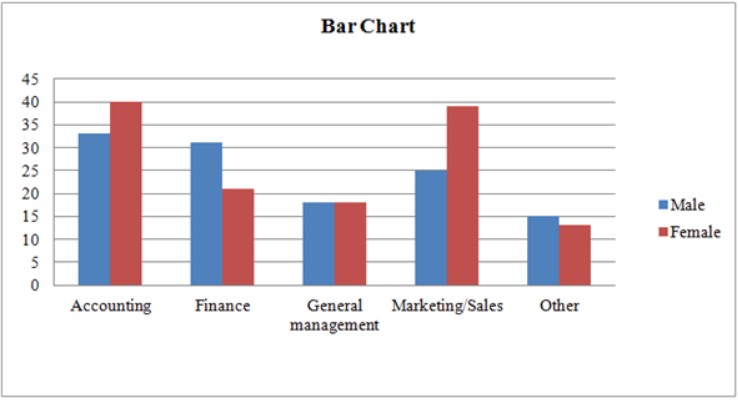
Excel output

Figure (1) shows that there is a difference exists between male and female in their area of employment. The bar in Figure (1) shows that the female are more likely to select accounting/marketing while male are more likely to select finance.
- Modification of the data is tabulated as follows:
|
Category |
Very satisfied |
Quite satisfied |
Little satisfied |
None |
|
Accounting |
1 |
18 |
136 |
18 |
|
Finance |
0 |
9 |
19 |
24 |
|
General management |
1 |
8 |
11 |
16 |
|
Marketing/Sales |
6 |
18 |
21 |
19 |
|
Other |
2 |
7 |
15 |
4 |
Table (2)
Use EXCEL to draw cluster bar graph of area of employment and job satisfaction.
EXCEL procedure:
Step1: Select the column of Category, Very satisfied, Quite satisfied, Little satisfied and
None.
Step2: Select Column > 20-Column.
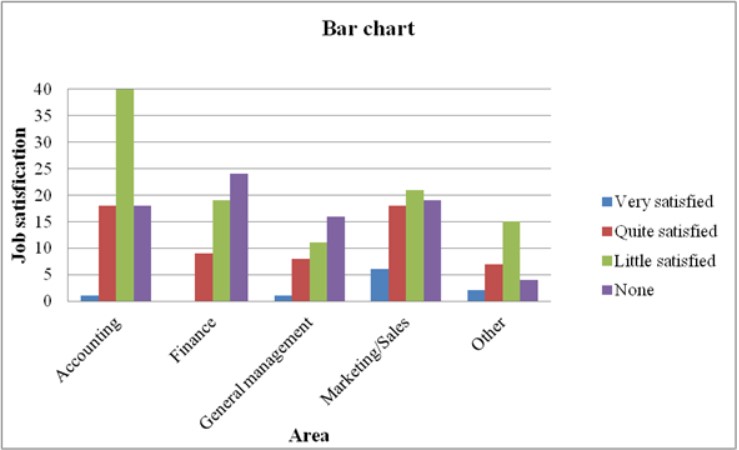
Excel Output
Figure (2)

Figure (2) shows that there exists a relationship between the area of employment and job satisfaction. It is clear that graduates those who are working in marketing/sales are very satisfied when compared to the others.
3.
Modification of the data is tabulated as follows for gender wise
Modification of the data is tabulated as follows
|
Category |
Male |
Female |
|
Accounting |
33 |
40 |
|
Finance |
31 |
21 |
|
General Management |
18 |
18 |
|
Marketing/Sales |
25 |
39 |
|
Other |
15 |
13 |
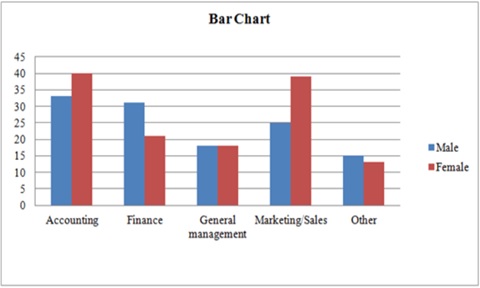
From Excel

Figure 3
Figure (3) shows that there exists a relationship between gender and area of employment. It is clear that graduates those who are working in Accounting, Finance and marketing/sales got higher jobs compared to the others.
- Table for gender and Job satisfaction
|
Category |
Male |
Female |
|
Accounting |
66 |
82 |
|
Finance |
50 |
39 |
|
General Management |
32 |
34 |
|
Marketing/Sales |
58 |
81 |
|
Other |
34 |
29 |

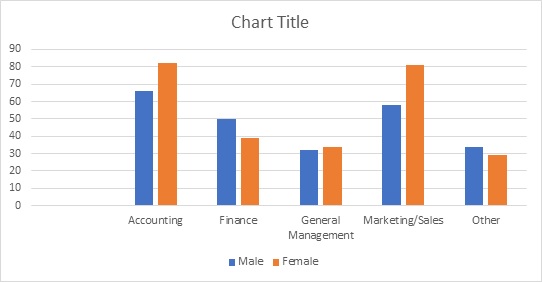
Figure 4
Figure (4) shows that there exists a relationship between gender and job satisfaction. It is clear that graduates genders those who are working in Accounting and marketing/sales got higher jobs compared to the others.
Resources
- 24 x 7 Availability.
- Trained and Certified Experts.
- Deadline Guaranteed.
- Plagiarism Free.
- Privacy Guaranteed.
- Free download.
- Online help for all project.
- Homework Help Services
Testimonials
Urgenthomework helped me with finance homework problems and taught math portion of my course as well. Initially, I used a tutor that taught me math course I felt that as if I was not getting the help I needed. With the help of Urgenthomework, I got precisely where I was weak: Sheryl. Read More

