STAT 202 Project
Introduction
The 2022 FIFA World Cup would be the first time such a big event will be hosted in the Middle East. This event is of high importance to the country’s image and Qatar’s vision 2030. Previous studies have highlighted the importance of understanding impacts of such mega events and with the right planning how they can be transformed into lasting legacies. The aim of the 2022 FIFA World Cup study was to assess how hosting the 2022 FIFA World Cup will change the quality of life of the people living in Qatar as well as those residing in the Gulf region (GCC). In particular, evaluating impacts the preparations for the 2022 FIFA World Cup will bring to the country and region.
Sampling frame
The Social and Economic Survey Research Institute (SESRI) developed the sampling frame between the months of March and April 2014 with assistance from the Qatar General Electricity Corporation (Kahramaa), that has all mail addresses in the country. In this sampling frame, all housing units in Qatar are listed with information about the housing address and information that identified if residents in the housing units were Qataris or expatriates. Similar to other countries in the Arab Gulf region, there are two distinct groups of population in Qatar: the Qatari nationals and the non-Qatari migrants. The latter group is also composed of two distinct groups: the white-collar migrant workers, usually called expatriates and the blue-collar migrant workers, usually called labor migrants.
Data Collection
The survey includes Qatari citizens and white-collar expatriates. In the 2022 FIFA World Cup Survey, respondents were asked a variety of questions related to perceived socio-cultural impacts, perceived economic impacts, perceived tourism industry impacts, perceived environmental impacts, and perceived knowledge development. Data were collected using systematic sampling in October 2014 from Qatari nationals and white-collar expatriates. Overall, 2,163 interviews with Qatari nationals (1,058) and white-collar expatriates (1,105) were completed.
Demographic data and measures
The collected data include the following variables:
- Perception of economic impacts was measured using a scale from 1 to 5 where 1 indicates strongly disagree at all and 5 indicates strongly agree were asked. These items include for the five items of, 1) provide local residents more employment opportunities, 2) improve provision of public services and infrastructure, 3) increase business opportunities and investments; 4) lead to regeneration and redevelopment of cities; 5) positive impact on salaries of new hires. A new variable (ECO) for the total positive impacts was created from the mean score of these items.
- Tourism impacts (Tour) were measured with four items including, 1) increase tourism in Qatar, 2) promote Qatar as a tourist destination, 3) enhance Qatar’s international reputation, 4) improve Qatar’s image worldwide. The score of positive impacts on the tourism in Qatar was created from the mean score of these items.
- Event support (Support): This outcome was measured with one item, “support the FIFA decision to host the World Cup in Qatar” that the respondents evaluated on a five-point scale, where 1indicates strongly disagree and 5 indicates strongly agree.
- Demographic data: age, gender (1 for male, 2 for female), and nationality (0 for Qatari, 1 for non-Qatari) we collected.
Questions: use the 2022 world cup data to answer the following questions:
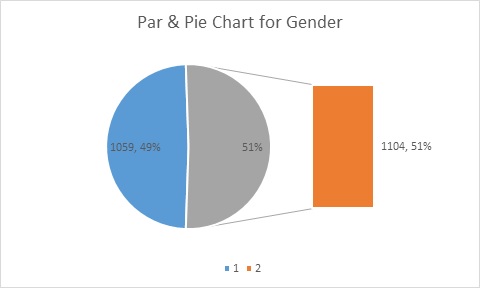
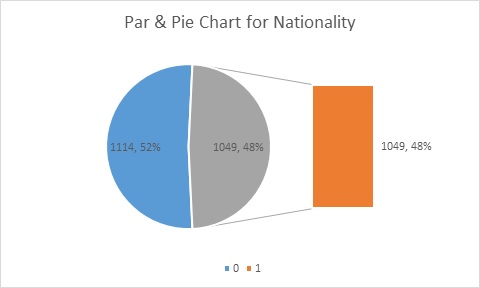
- Include a relative frequency table, and par & pie charts for the gender and nationality in you sample, briefly comment on your charts.
Gender
|
Frequency Table | ||
|
Gender |
Frequency |
Cumulative Frequency |
|
1 |
1059 |
1059 |
|
2 |
1104 |
2163 |

From this par & pie chart, there are more women (1104) present in the country. It can be considered that there are less opportunities present for the women to leave the country or do any kind activity which why there seems to be more women. However, it can be seen by the graph that the difference between the gender in Qatar is 2%.
Nationality
|
Frequency Table | ||
|
Nationality |
Frequency |
Cumulative Frequency |
|
0 |
1114 |
1114 |
|
1 |
1049 |
2163 |

This graph on nationality indicates that there are more local i.e. Qatari Nationality than non-Qatari Nationality. While the par & pie chart shows a difference between nationality present it is a difference of only 4%.
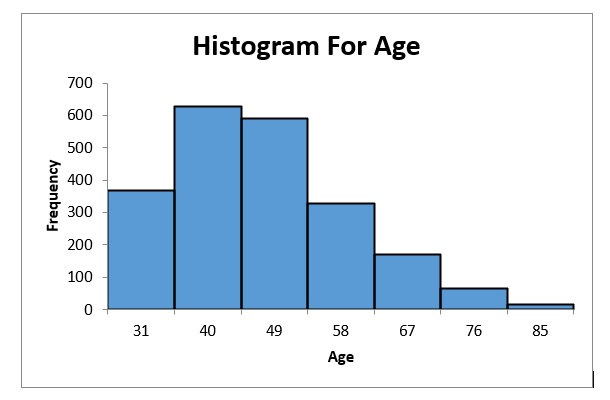
- Include a histogram for (age). Describe the shape of the distribution (e.g. is it right skewed? unimodal or bimodal?). Note that you will need to play around to find a bin size that works best with your data.
|
Bin Begins |
Bin Ends |
Frequency |
|
23 |
31 |
368 |
|
32 |
40 |
627 |
|
41 |
49 |
591 |
|
50 |
58 |
328 |
|
59 |
67 |
169 |
|
68 |
76 |
64 |
|
77 |
85 |
16 |

From the histogram, the age is right skewed. It can be stated that the ages between 40-50 are befitting with the possible FIFA World Cup conducting in Qatar, this may be as it will help with there business or work and economy.
- Report the mean, median, mode, first quartile, third quartile, interquartile range (IQR), and the standard deviation of ages in the sample. Which measure for the central location is more appropriate for ages? Explain why.
|
Central Location |
Value |
|
Mean |
42.84 |
|
Median |
41 |
|
Mode |
41 |
|
1st Quartile |
34 |
|
3rd Quartile |
50 |
|
Inter Quartile Range (IQR) |
16 |
|
Standard Deviation |
12.02 |
From this data, the more appropriate use of measure for central location are the median, the 1st quartile, the 3rd quartile and the IQR. This is because the median gives a better idea of where most of the age lies compared to the mean and mode, as mode and mean values may chance drastically even if one value chances. As for the 1st quartile and 3rd quartile a long with the IQR gives an idea on the various values from each division of the age group and the distance between.
- Find the range of (interval) and use the appropriate rule (empirical or Chebyshevt) to find the percentage (proportion) of values that fall within two standard deviations from the mean of ages.
The overall range for age is 62. Thus, to see the percentage of proportion of values that falls within two standard deviation the range interval that has been selected it 23 and 85.
Using the empirical rule, the percentage of proportion that falls within two standard deviation from the mean of ages, i.e. the mean is 42.84 with a standard deviation of 12.02, is 95.03%.
Using Chebyshev, the proportion that falls within two standard deviation from the mean of ages is between 39 and 44 with a mean of 42.84 and a standard deviation of 12.02.
- Calculate the coefficient of variation of ages. Do the ages of males have more variation than the ages of females?
|
Calculations |
Females |
Males |
|
Mean |
41.3550725 |
44.3956563 |
|
Standard Deviation |
43.5093584 |
36.1603892 |
|
Coefficient of Variation |
1.05209242 |
0.81450286 |
From this data calculation for coefficient of variation of ages, it can be said that the ages of men have less variation than the age of females. That is because the standard deviation for the age of women are closer to the mean compared to the standard deviation to the mean for the age of the men.
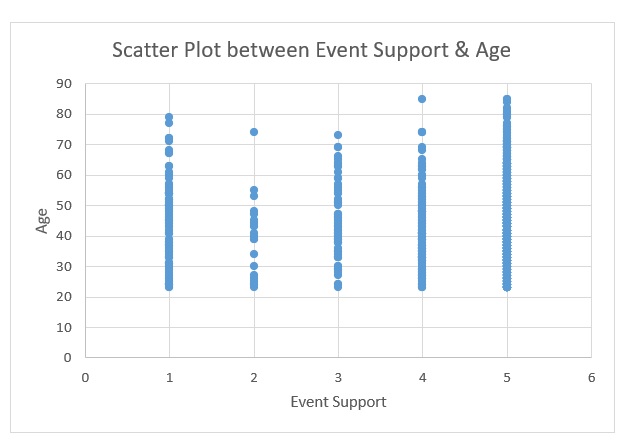
- Draw a scatter diagram and state your recommendations about the relationship between the event support and ages in your sample.

From the scatter diagram, most of the ages who gave the survey are showing their support for the FIFA World Cup as there is no outliers present and it is densely located at the support of the FIFA World Cup happening at Qatar. However, there are some disagreement and not satisfied that the FIFA World Cup should happen at Qatar.
- Do optimistic people for the economic impacts have positive insights for the tourism impacts? Use an appropriate statistical measure to verify your conclusion.
The optimistic people for the economic impacts do have a positive insight for the tourism impacts. There values more towards level of strongly agree (5) in the economic impacts as it seems that the tourism impacts directly in the future. The statistical measures that help in showing that is average or mean impact of 4.60 and 4.84 for economic impacts and tourism impacts respectively. Also, the maximum value of impact that is coming up for both the economic impact and tourism impact is 5. This shows that with the FIFA World Cup happening at Qatar there are people who are optimistic that there will be an impact on the economy and the tourism.
Resources
- 24 x 7 Availability.
- Trained and Certified Experts.
- Deadline Guaranteed.
- Plagiarism Free.
- Privacy Guaranteed.
- Free download.
- Online help for all project.
- Homework Help Services
Testimonials
Urgenthomework helped me with finance homework problems and taught math portion of my course as well. Initially, I used a tutor that taught me math course I felt that as if I was not getting the help I needed. With the help of Urgenthomework, I got precisely where I was weak: Sheryl. Read More

