Performance of the induction motors and the three main tests
Lab no 3
Introduction:
This lab is about the performance of the induction motors and the three main tests are performed i.e. No load test, locked rotor test and DC winding resistance test. In the later part of this lab, the torque versus speed graph has been determined in order to checked the motor performance at full rated voltage and fixed frequency. The following test are performed in this lab and the brief overview of these tests were given as
Induction Machine No-Load Test:
This test is used to find the induction machine equivalent parameter. Since the induction machine has similar with the transformer so this test is same as the test that is performed for the transformer as an open circuit test. This test is used to find the magnetization component of induction moto such as and . When the motor is running at no load, the input power is equal to the power that has iron loss and windage loss.
Induction Machine Blocked Rotor Test:
Blocked rotor test of induction machine is same as like the transformer short circuit test. In blocked rotor test, the rotor is locked and it is not able to move. The slip-type induction machine has rotor winding is made short. The power in case of blocked rotor test is equal to the sum of copper losses that is occurring in the stator and rotor circuits. In this case the core and mechanical losses are ignored.
DC Winding Test:
The DC winding test is the measure of resistance which has copper wires. This test is performed in stator by disconnecting the supply to check the resistance of stator when there is no supply.
Equivalent circuit of Induction motor:
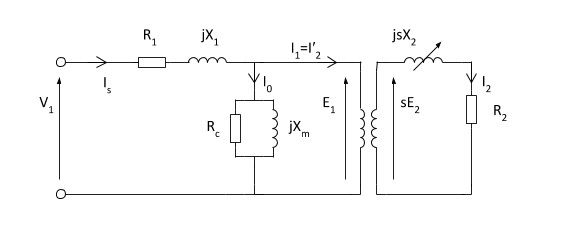
Figure 1 Equivalent circuit of Induction Motor
and is the magnetization resistance and inductance of the component which is obtained from the No-load induction motor test whereas the and is the resistance and inductance that is obtained from the induction machine locked rotor test.
Procedure:
No-Load induction machine test:
In this test the first of all the circuit has been wired up according to the figure shown as below after that the laboratory attendant has been called for assistance and then variac voltage has been set to zero. In the next part of this experiment, the circuit has been connected to the main supply and then in the end the supply has been turned ON and the measurements has been made.
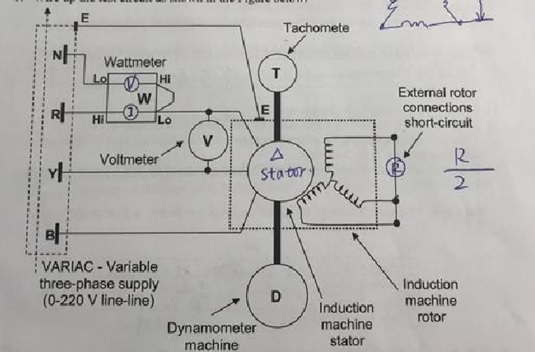
Figure 2 Induction Machine No-Load Test Diagram
Induction machine Locked Rotor test:
In this test, the rotor has been locked and the labortary attendant has been called for assistance and checking of the circuit. The variac voltage has been increased and the reading has been made from the power meter.
Torque Versus Speed Test at Full Voltage, Fixed Frequency:
In the last test, the locked rotor test has been performed before starting the test it was ensured that the whether the rotor locking has been removed or not after that the variac voltage has been set to zero. The laboratory assistance has been called for the assistance and the circuit has been connected to the main supply. After turning ON the variac dial the line voltage has been displayed on the fluke voltmeter.
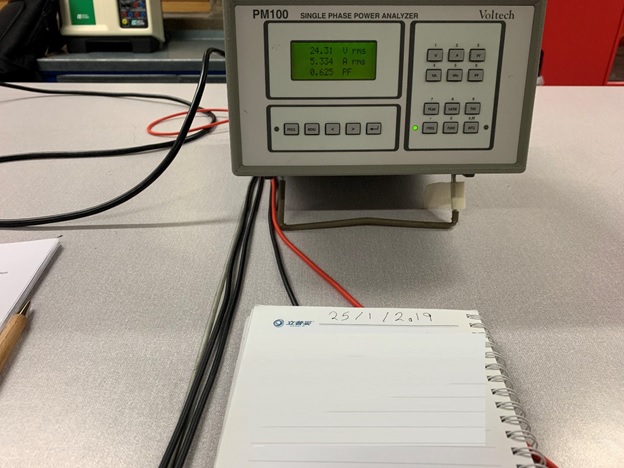
Figure 3 Image of the Experiment performed in the Lab
Results:
No-Load Test:
Induction Machine Locked Rotor Test:
Torque Versus Speed Test at Full Voltage, Fixed Frequency:
|
Power Meter Reading |
Calc |
Test-rig Reading |
Calc |
Calc |
Calc |
Calc | |||
|
Voltage (V) |
Current (A) |
Electrical Power (W) |
Power Factor |
Torque (Nm) |
Speed (RPM) |
Speed (rad/s) |
Slip |
Mechanical Power (W) |
Efficiency (%) |
|
0 | |||||||||
|
10.80815 | |||||||||
|
20.63154 | |||||||||
|
29.24187 | |||||||||
|
36.49908 | |||||||||
|
42.80563 | |||||||||
|
47.70561 | |||||||||
|
51.87247 | |||||||||
DC Winding Test:
|
Resistance of Stator | |
|
Resistance of Rotor |
Theoretical Calculations:
No load Test:
The Core Resistance is given as
The Magnetizing reactance is given as
Locked Rotor Test:
Hence the Induction motor equivalent parameters are
Discussion of Results:
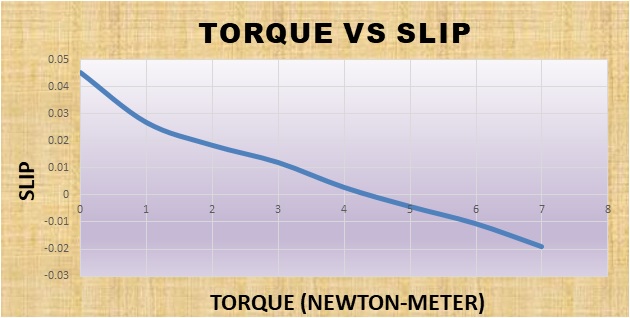
This lab is about the three test of induction motor in order to find the induction motor equivalent parameters and the no load test is performed to determine the induction motor magnetization components, the voltage and current were also find when the motor is running at No-Load. Similarly, Locked rotor test is performed in order to find the Induction motor copper loss. The voltage and current were measured and given in the result section. In the later part of this lab, the torque versus speed test was done at full rated voltage and fixed frequency in order to check the motor performance when there is an increase in the torque. It was noticed when the torque is increased the slip of the motor starts decreasing and the value of induction machine becomes negative. This means when the slip is negative the induction motor is running as a generator which is giving power to the load.
Conclusion:
In this lab, the induction motors performance has been analyzed and it equivalent circuit parameters has been find and then these parameters were used in induction motor and the torque versus speed graph has been plotted in the under the fixed rated voltage and frequency. The graph clearly indicates when the torque increases the slip becomes negative. The induction motors are mostly used in the industries for different purposes and it is considering to be the backbone of the industry which is used for different purposes such as for cooling, pumping and a conveyer.
Lab no 4
Introduction:
This lab is about the power system analysis. In this lab, the power system has been taken, generally a power system consists of three main components which includes generation, transmission and distribution. The simulation has been performed on Simulink for two different parts. First of all, the understanding of the model has been developed in which the single line power system is made on Simulink. In the second part of this lab, the inductive load has been introduced.
Single line diagram of the power system:
The single line diagram of the power system represents all the three transformation of power i.e. generation, transmission and distribution. Generally, the power system consists of two or more than two power sources which is further connected to the transformer which is used to step-up the voltage. The transmission is done at high voltage in order to remove the line losses.

Figure 4 Single line diagram of Power System
Basic Summary:
Part 1:
Understanding the Model and Running the Default Event Simulation:
- First of all, the Simulink files has been opened and the mask parameters has been set for the synchronous generator (SG) and then M1 in area 1 and transformer as per according to the SI units.
- The simulation has been run for 2 second and the bus voltage waveforms has been noted.
- The average power through bus is also noted
- After noting all the components, the screenshot of the result has been taken.
Part 2:
A sudden change in load demand:
- Now first of all, the elements were removed that is used in part 1.
- A circuit breaker is connected between the load and the bus and it is switched on for
- The simulation has been run and then following waveforms has been observed
- Voltage waveform at bus 1 and bus 2
- Average current through bus 1
- The machine rotational speeds
- The active power of generator
Results:
Understanding of the model and running the default event simulation:
The mask parameters are given as
|
Sr.no |
SG parameters |
Value [unit] |
Transformer |
Value [unit] |
|
1 |
Rated Power |
Nominal Power |
(VA) | |
|
2 |
Frequency |
60 Hz |
Magnetization Inductance | |
|
3 |
Line to line voltage |
Magnetization Resistance | ||
|
4 |
Reactance |
Frequency |
The voltage at bus 1 is given as
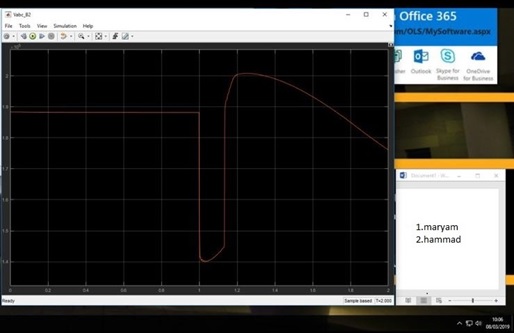
Figure 5 Voltage at bus 1
The combine voltage at bus 2 and the average power through bus 1 is given as
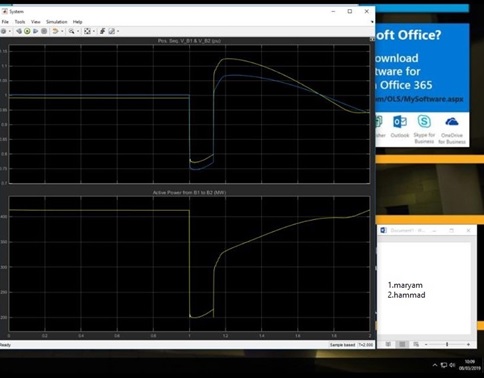
Figure 6 Voltage at bus 2
Part 2: New event- a sudden change in the load demand:
The voltage at the bus 1 is given as
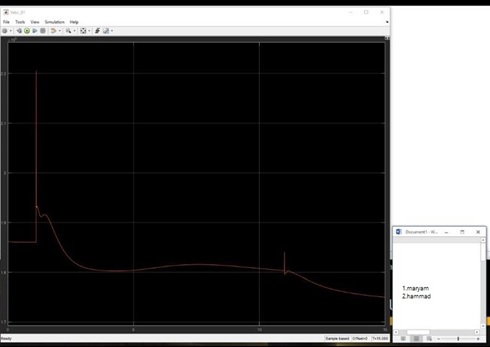
Figure 7 Voltage at bus 1
The voltage at bus 2 is given as
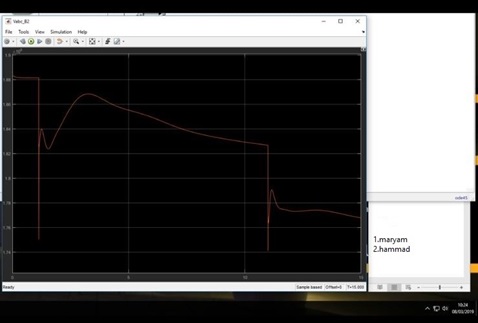
Figure 8 Voltage at bus 2
The average power through bus 1 is given as
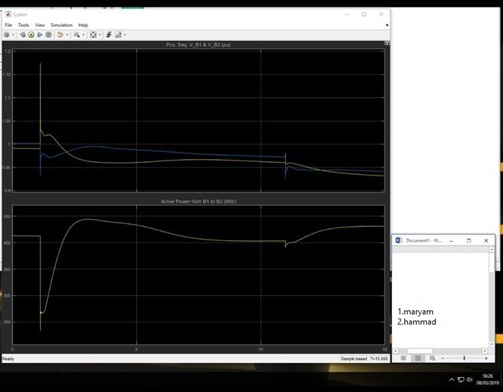
Figure 9 Average Power from Bus 1
The machine speed is given as
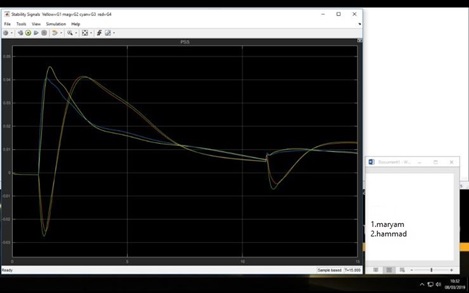
Figure 10 Machine speed graph
|
Voltage |
Active Power | ||
|
Frequency |
Reactive Power |
Questions Asked in the Lab:
- What does a Mask in Simulink mean?
Answer: The mask in the Simulink enables us to create the block which has parameters. for example, if the generator is taken from the library browser then its masks parameter must be set.
- What can be defined as power plant in the given model?
The power plant is always in the power system that is used for the generation of electric power. When we study a complete single line diagram of the power system, there must be a power plant that is used for the generation of electricity and this electricity is then transmitted and distributed.
- What will occur in the system during event?
The voltage at bus has initially constant but there is a decrease in the graph during transmission this may be due to the losses that occurs in the transmission line. Similarly, the graph of the power has same behavior. The active power is the useful power that is used by the load. Similarly, during the transmission there is decrease in the power.
- How much the ratio of the fault peak power to the nominal power?
The ratio of the fault power peak to nominal power is .
- A circuit breaker should be included in between the load and the bus to be switched on at ?
The circuit breaker is included so that fault current does not flow through the system. When there is a flow of fault current, the circuit breaker is ON.
Discussion of Results:
In this lab, the two experiments were performed, first of all the simple model has been run in which a single line power system is tested. A single line diagram of the power system consists of three main components i.e. generation, transmission and distribution. The generator parameters have been set in which the nominal power, line to line voltage, frequency and reactance of the generator has been set and the transformer parameters are also set in which the nominal power, frequency, magnetization resistance and inductance has been set by giving values to it. The waveforms of the voltage at the bus 1, bus 2 and the average power of the bus has been measured. The circuit breaker is also connected in order to prevent the fault current. It was noted that the voltage at bus 1 is constant but it decreases after 1 sec, this is due to the transmission losses and then after some time it reaches to its steady state value.
In the second part of the simulation, a three phase load has been attached with the Bus B2 which has active power of and reactive power of . Since it is inductive load so it has greater amount of the reactive power. The waveform for the voltage at bus 1 and bus 2 is measured and average power is also measured. Due to inductive load, there is a dips in the graph in which we can see when there is an increase in the load, the voltage decreases. The waveform of the voltage at bus 2 is not uniform like in case for the part 1 in which the voltage at bus 2 is measured at no load conditions.
Conclusion:
This lab is about the power system in which the two cases were discussed in the first case a single line power system has been tested on Simulink and waveform for the voltage at the bus 1 and bus 2 has been measured. The waveforms and all the discussion has been given in the result section. In the second the load has been introduced at bus 2. So this lab gives us the basic behavior of the power system that how the voltage at bus changes when there is an increase in the load. Moreover, the circuit breaker has been also used in order to prevent the fault current.
References:
Electrical Engineering - Power System Analysis. (n.d.). Retrieved from https://nptel.ac.in/courses/108105067/2
Eep. (2017, December 29). Basics of 3-phase Induction Motor (part 1). Retrieved from https://electrical-engineering-portal.com/basics-of-3-phase-induction-motor-1
Understanding ac induction motor basics. (2017, March 08). Retrieved from https://www.plantengineering.com/articles/understanding-ac-induction-motor-basics/
JoVE. (n.d.). Retrieved from https://www.jove.com/science-education/10150/ac-induction-motor-characterization
Ee. (2017, October 12). Basics of Induction Motors. Retrieved from http://www.basicsofelectricalengineering.com/2017/08/basics-of-induction-motors.html
Buy Performance of the induction motors and the three main tests Assessment Answers Online
Talk to our expert to get the help with Performance of the induction motors and the three main tests Assessment to complete your assessment on time and boost your grades now
The main aim/motive of the management assignment help services is to get connect with a greater number of students, and effectively help, and support them in getting completing their assignments the students also get find this a wonderful opportunity where they could effectively learn more about their topics, as the experts also have the best team members with them in which all the members effectively support each other to get complete their diploma assignments. They complete the assessments of the students in an appropriate manner and deliver them back to the students before the due date of the assignment so that the students could timely submit this, and can score higher marks. The experts of the assignment help services at urgenthomework.com are so much skilled, capable, talented, and experienced in their field of programming homework help writing assignments, so, for this, they can effectively write the best economics assignment help services.
Get Online Support for Performance of the induction motors and the three main tests Assessment Assignment Help Online
Resources
- 24 x 7 Availability.
- Trained and Certified Experts.
- Deadline Guaranteed.
- Plagiarism Free.
- Privacy Guaranteed.
- Free download.
- Online help for all project.
- Homework Help Services
Testimonials
Urgenthomework helped me with finance homework problems and taught math portion of my course as well. Initially, I used a tutor that taught me math course I felt that as if I was not getting the help I needed. With the help of Urgenthomework, I got precisely where I was weak: Sheryl. Read More

