FISV5526 Finance Reporting and Control
Starbucks Valuation
FISV5526 Finance Reporting & Control
General Information
Our analysis will focus on the financial data for Starbucks versus Dunkin Donuts. The company specific data was conducted using data from the United States Securities and Exchange Commission. We also leveraged stock analysis on net and GuruFocus and Macrotrends.net for industry ratios.
Short Term Liquidity
According to Investopedia, a company's liquidity is its ability to meet its short-term financial obligations. Liquidity ratios attempt to measure a company's ability to pay off its short-term debt obligations. This is done by comparing a company's most liquid assets, those that can be easily converted to cash, with its short-term liabilities. The current ratio is a good measurement to understand the short term liquidity in a company. A current ratio lower than one is a red flag. This means that the company may not be able to pay off short term debt.
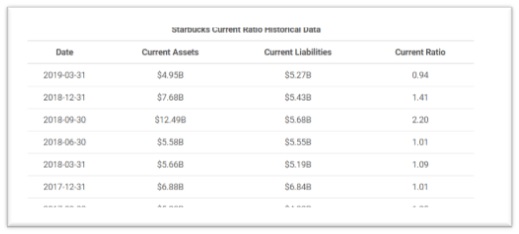
According to GuruFocus Starbucks Corp's current ratio for the quarter that ended in Mar. 2019 was 0.94. This indicates that the company may have difficulty meeting its current obligations. Low values, however, do not indicate a critical problem. If Starbucks Corp has good long-term prospects, it may be able to borrow against those prospects to meet current obligations. Dunkin' Brands current ratio for the three months ending March 31, 2019 was 1.54. This means Dunkin has a better ratio than Starbucks. Dunkin has more financial security because their ratio is above 1. This indicates a strong ability to pay off short term debt because their current assets far exceed their current liabilities.


Capital Structure
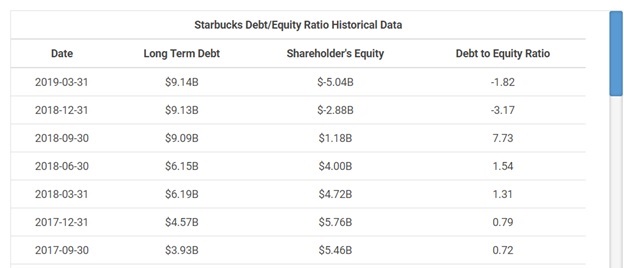
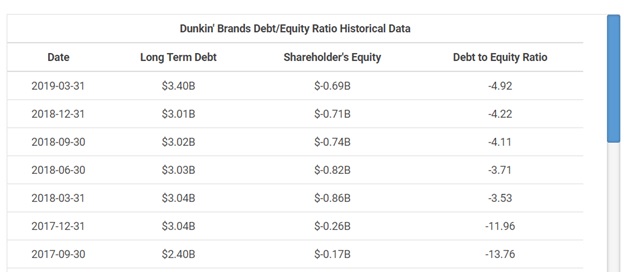
The debt-to-equity ratio is calculated by dividing a company's total liabilities by its shareholder equity. These numbers are available on the balance sheet of a company's financial statements. The ratio is used to evaluate a company's financial leverage.

Current Ratio
Starbucks Corp has a current ratio of 0.94. It indicates that the company may have difficulty meeting its current obligations. Low values, however, do not indicate a critical problem. If Starbucks Corp has good long-term prospects, it may be able to borrow against those prospects to meet current obligations. During the past 13 years, Starbucks Corp's highest Current Ratio was 5.12. The lowest was 0.65. And the median was 1.57. The current ratio is mainly used to give an idea of the company's ability to pay back its short-term liabilities with its short-term assets.
Starbucks Corp's Current Ratio for the fiscal year that ended in Sep. 2018

Starbucks Corp's Quick Ratio for the quarter that ended in Mar. 2019 is calculated as

The current ratio can give a sense of the efficiency of a company's operating cycle or its ability to turn its product into cash. Companies that have trouble getting paid on their receivables or have long inventory turnover can run into liquidity problems because they are unable to alleviate their obligations. Because business operations differ in each industry, it is always more useful to compare companies within the same industry.
Acceptable current ratios vary from industry to industry and are generally between 1 and 3 for healthy businesses.
The higher the current ratio, the more capable the company is of paying its obligations. A ratio under 1 suggests that the company would be unable to pay off its obligations if they came due at that point. While this shows the company is not in good financial health, it does not necessarily mean that it will go bankrupt - as there are many ways to access financing - but it is definitely not a good sign.
If all other things were equal, a creditor, who is expecting to be paid in the next 12 months, would consider a high current ratio to be better than a low current ratio, because a high current ratio means that the company is more likely to meet its liabilities which fall due in the next 12 months.
Net Operating Asset Turnover
Asset Turnover measures how quickly a company turns over its asset through sales. It is calculated as Revenue divided by Total Assets. Starbucks Corp's Revenue for the three months ended in Mar. 2019 was $6,306 Mil. Starbucks Corp's Total Assets for the quarter that ended in Mar. 2019 was $18,812 Mil. Therefore, Starbucks Corp's asset turnover for the quarter that ended in Mar. 2019 was 0.34.
Asset Turnover is linked to ROE % through Du Pont Formula. Starbucks Corp's annualized ROE % for the quarter that ended in Mar. 2019 was -66.97%. It is also linked to ROA % through Du Pont Formula. Starbucks Corp's annualized ROA % for the quarter that ended in Mar. 2019 was 14.10%.
Asset Turnover measures how quickly a company turns over its asset through sales.
Starbucks Corp's Asset Turnover for the fiscal year that ended in Sep. 2018 is calculated as

Starbucks Corp's Asset Turnover for the quarter that ended in Mar. 2019 is calculated as

Companies with low profit margins tend to have high asset turnover, while those with high profit margins have low asset turnover. Companies in the retail industry tend to have a very high turnover ratio.
Gross Margin and Return on Net Operating Assets
Gross Margin % is calculated as gross profit divided by its revenue. Starbucks Corp's Gross Profit for the three months ended in Mar. 2019 was $1,753 Mil. Starbucks Corp's Revenue for the three months ended in Mar. 2019 was $6,306 Mil. Therefore, Starbucks Corp's Gross Margin % for the quarter that ended in Mar. 2019 was 27.79%. During the past 13 years, the highest Gross Margin % of Starbucks Corp was 58.75%. The lowest was 26.70%. And the median was 30.37%. Starbucks Corp had a gross margin of 27.79% for the quarter that ended in Mar. 2019 => Competition eroding margins
Gross Margin is the percentage of Gross Profit out of sales or Revenue.
Starbucks Corp's Gross Margin for the fiscal year that ended in Sep. 2018 is calculated as

Starbucks Corp's Gross Margin for the quarter that ended in Mar. 2019 is calculated as

A positive Gross Profit is only the first step for a company to make a net profit. The gross profit needs to be big enough to also cover related labor, equipment, rental, marketing/advertising, research and development and a lot of other costs in selling the products.
Warren Buffett believes that firms with excellent long term economics tend to have consistently higher margins.
Durable competitive advantage creates a high Gross Margin % because of the freedom to price in excess of cost. Companies can be categorized by their Gross Margin %
- Greater than 40% = Durable competitive advantage
- Less than 40% = Competition eroding margins
- Less than 20% = no sustainable competitive advantage
- Consistency of Gross Margin is key
Starbucks Corp had a gross margin of 27.79% for the quarter that ended in Mar. 2019 => Competition eroding margins
If a company loses its competitive advantages, usually its gross margin declines well before its sales declines. Watching Gross Margin % and Operating Margin % closely helps avoid value trap situations.
Return on Net Operating Assets
Return on assets is calculated as Net Income divided by its Total Assets. Starbucks Corp's annualized Net Income for the quarter that ended in Mar. 2019 was $2,653 Mil. Starbucks Corp's Total Assets for the quarter that ended in Mar. 2019 was $18,812 Mil. Therefore, Starbucks Corp's annualized return on assests (ROA) for the quarter that ended in Mar. 2019 was 14.10%. During the past 13 years, Starbucks Corp's highest Return on Assets (ROA) was 23.80%. The lowest was 0.08%. And the median was 18.35%.
Starbucks Corp's annualized Return on Assets (ROA) for the fiscal year that ended in Sep. 2018 is calculated as:

Starbucks Corp's annualized Return on Assets (ROA) for the quarter that ended in Mar. 2019 is calculated as:

Return on assets (ROA) measures the rate of return on the total assets (shareholder equity plus liabilities). It measures a firm's efficiency at generating profits from shareholders' equity plus its liabilities. ROA shows how well a company uses what it has to generate earnings. ROAs can vary drastically across industries. Therefore, return on assets should not be used to compare companies in different industries. For retailers, a ROA of higher than 5% is expected. For example, Wal-Mart (WMT) has a ROA of about 8% as of 2012. For banks, ROA is close to their interest spread. A banks ROA is typically well under 2%.
Similar to ROE, ROA is affected by profit margins and asset turnover. This can be seen from the Du Pont Formula:

The Net Income data used here is four times the quarterly (Mar. 2019) net income data. The Revenue data used here is four times the quarterly (Mar. 2019) revenue data.
Reference URL for works cited
https://www.gurufocus.com/term/current_ratio/SBUX/Current-Ratio/Starbucks-Corp
https://www.macrotrends.net/stocks/charts/SBUX/starbucks/current-ratio
Resources
- 24 x 7 Availability.
- Trained and Certified Experts.
- Deadline Guaranteed.
- Plagiarism Free.
- Privacy Guaranteed.
- Free download.
- Online help for all project.
- Homework Help Services

