Customer Service and Research Skills
Customer Service and Research Skills
Executive Summary
The objective of the research is to incorporate a report that is able to analyse the data regarding customer complaints. It is found that the outcomes of the research provide a solution regarding addressing the issues of customer complaints and how to improvise the situation to reduce them and maximize consumer satisfaction. It is to be noted that in the findings the key factors for customer complaints how to be staff member Basil and product quality which is necessary to be addressed in an appropriate manner followed by rendering customer care training program as well as by changing the quality policy of the products that are served to the consumer base.
Introduction
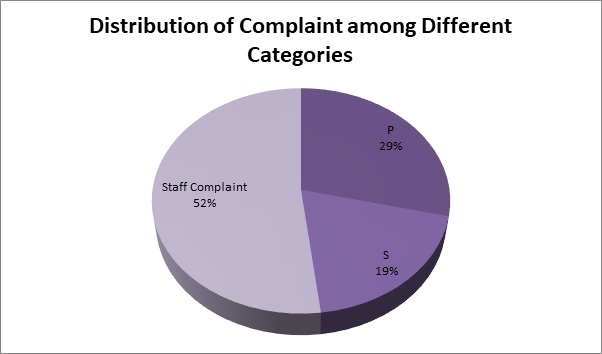
It is to be noted that the report focuses upon the customer complaints which are found to be increasing over time in the organisation as the statistics shows that over a 12 month period there is significant outcomes which are a matter of concern in case of customer service. In the present context analysis has been incorporated based upon the data to provide a review as well as a resolution to overcome the problem regarding mitigation of customer complaints. The key indicators on this regard are related to maintaining focus upon customer complaint that is being recorded. It is been found that K, R and B represents the fact that the complaints were caused by the relevant staff whereas P indicate the fact that the complaints are caused due to the product while S represent the fact that the complaints were a result of external service providers. Recommendations are present in the report in the form of policies and procedures to comprehend the research skills.
Data Methodology
In order to analyse the data, it is required that the process information should be accessed based upon both the mix of qualitative and quantitative research techniques due to the reason that both of the techniques at a different level of significance in terms of interpreting the data. Quantitative techniques may perform generalisation of outcome from a sample data set however its approach to handle that datasets are in the form of tabulation along with statistical measurements. On the other hand, it is been found that the qualitative approach may be implemented with non-statistical methodology but it provides insight regarding the issues under consideration. Here I have incorporated Statistical Techniques to elaborate upon the issue and explore the root cause of the problem in order to address it appropriately.
1. Analyse your data findings from the scenario provided?
In this provided scenario there is key annotation that represents the category of the customer’s list of complaint against the company. The tabular presentation provides the interpretation of developing records of K, R, P, S and B. The abbreviations which are the part of the provided scenario stand for different purposes. The annotation of k, B and R represents the number of significant customers, who have registered their complaint against the company. On the other hand, P stands for the number of complaints that have been launched by the customers against the issue related to the consumption of products. S represents the number of complaints that have been taken place in the scenario due to the external service provider.
The interpretation of K stands for Kasyme, R is for Raquel and B is for Basel. The annotation of K refers to a single complain launched by Kasyme and S represents number of two complains against the external service providers of the company. The scenario represents the weekly analysis of the number of complaints that have been delivered by the pivotal customers against the company. In the first week of Monday, there have been 2 complains, whereas there is complain regarding the company’s product. Kasyme have launched complain on Friday and Basel has launch on Sunday. On the second week, Monday has presented the complaint by Basel regarding the issue from product. There are two complaints on Thursday. On the Sunday against complain have been launched by Kasyme regarding the product issue. It can be analyse that the scenario have presented the number of complains that are huge in number of product issue and external service provider.
2. What are your findings from this data analysis? What impact will this data have on company?
From the analysis, it can be conclude that the data sheet have portrayed numerous complaints that have been delivered by Kasyme, Basel and Raquel. The data analysis have presented the weekly analysis of number of complains, which are against the company’s product and external service providers. Through the help of data analysis, it has become lucid that the company’s quality of the product is not up to the mark and inefficient for use by the customers. Company lacks the credibility to produce beneficial products and henceforth, it can be relate from the data analysis that company is unable to gain profitable results due to the presence of customer’s dissatisfaction.
Another vital reason due to which the number of complaints are high than averages is presence of major issue on the part of the external service provider of the company. the quality of product and external service provider helps to enhance the sustainability of the company in the global market but if this two important factor fails to perform the responsibility (to gain customer satisfaction), that results in the form of loss to the company.
The data will put an adverse impact in the company because the data reflects the deficiency that is present in the company. The data analysis has helped the company to scrutinize the loopholes due to which it will be difficult to retain in the global market. Through the help of data analysis, the company will improve the quality of the product with the help of advanced technology in order to gain customer’s satisfaction. The implementation of developed research skill will help to improve the customer service quality to meet the requirements of the customer.
3: Data Findings and Graphical Representation:
The numbers of complaints per week are shown as follows:
A: Table:
|
Week |
Number of Complaints per Week |
|
1 |
4 |
|
2 |
6 |
|
3 |
7 |
|
4 |
5 |
|
5 |
4 |
|
6 |
5 |
|
7 |
7 |
|
8 |
2 |
|
9 |
2 |
|
10 |
3 |
|
11 |
9 |
|
12 |
2 |
|
13 |
3 |
|
14 |
3 |
|
15 |
5 |
|
16 |
1 |
|
17 |
2 |
|
18 |
2 |
|
19 |
8 |
|
20 |
2 |
|
21 |
2 |
|
22 |
3 |
|
23 |
3 |
|
24 |
5 |
|
25 |
1 |
|
26 |
2 |
|
27 |
3 |
|
28 |
6 |
|
29 |
2 |
|
30 |
3 |
|
31 |
2 |
|
32 |
5 |
|
33 |
3 |
|
34 |
1 |
|
35 |
1 |
|
36 |
5 |
|
37 |
2 |
|
38 |
1 |
|
39 |
2 |
|
40 |
6 |
|
41 |
2 |
|
42 |
2 |
|
43 |
1 |
|
44 |
5 |
|
45 |
3 |
|
46 |
5 |
|
47 |
2 |
|
48 |
5 |
|
49 |
1 |
|
50 |
4 |
|
51 |
3 |
|
52 |
8 |
It is been found the flow of complaints are high in some weeks and low in the other weeks.
B: Graphical Representation:
Graph number 1:
The following graph represents the number of complaints on weekly basis.
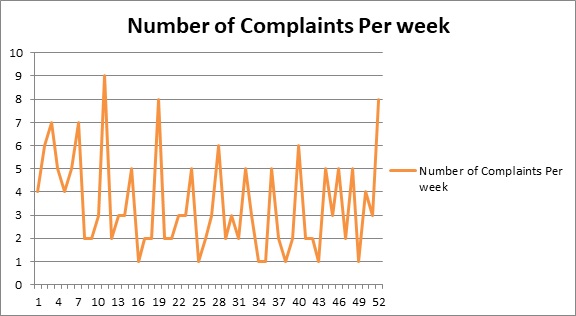
It is being found that on the 10th the week the number of complaints is the highest. Notably, the quarterly distribution of the complaints can be incorporated as follows:
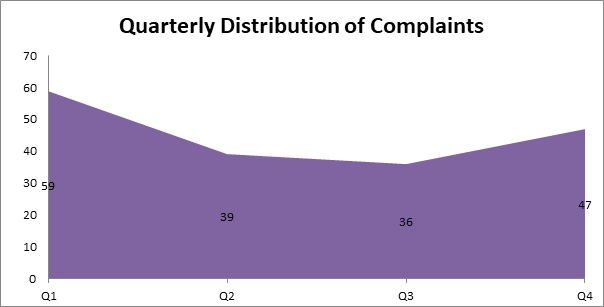
From the above diagram, it is been found that the number of complaints on a quarterly basis is different in different quarters. It is been seen that in the first quarter the number of complaints is 59 which is the highest while on the fourth quarter it is 47 and the lowest complaints are in the third quarter which is 36.
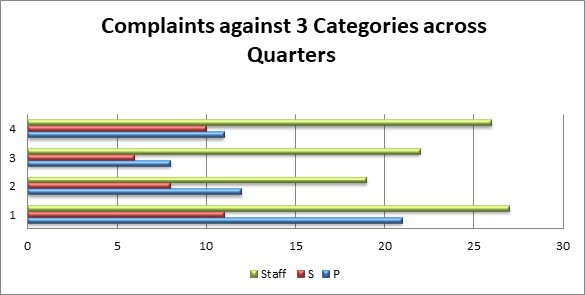
It is been represented in the formation diagram the Complaints against different quarters for the various members have significantly varied. It is also being found that the major complaints took place due to the staff members.
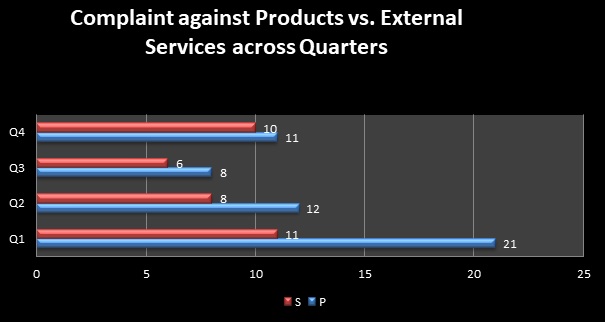
Complaints on a quarterly basis are been compared between complaints due to products to that of Complaints against the external service providers. Here it is been found that the major complaints received are against the products and less amount of complaint has been received against the external service providers in all the quarters. The statistical analysis reflects the fact that there is a proportional relationship between the number of the complaint is the product and that of the Complaints received against the external service providers. This is due to the reason that in the first quarter of the ratio between complaints received against the service provider is 11 while the Complaints received against the products is 21 which represents an approximately 1:2 relationship. In the second quarter also the Complaints received against the product is 12 while the same received against the service providers are 8 which represents a 2:3 relationship. In the third quarter, the relationship is 3:4 while in the fourth one the relationship is 1:1. This clearly depicts the fact that with the increase in weeks the number of complaints received for the product as well as the number of complaints received against the external service provider is almost similar which was not the sinner in the first quarter as in that case the Complaints received in case of the product very much higher than that of the external service providers. This interprets the fact that the company have focused introducing the Complaints received against the products for which by the first quarter it has reduced to 8 however at the cost of taking care of the products the company have given less focus upon the Complaints received against the external service providers for which it has raised gradually from the first quarter till the fourth quarter. It is recommended that the organisation should focus on improving the external service providers so that a lesser amount of complaints may get received against them over time.
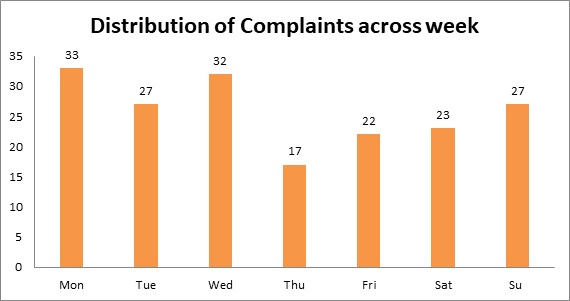
The distribution of complaints in various weeks is being incorporated in the aforementioned diagram where it is been found that specifically on Monday is the number of complaints about higher while on witness day also it is the second highest and on Thursday the number of complaints is the lowest across all the days in a week.
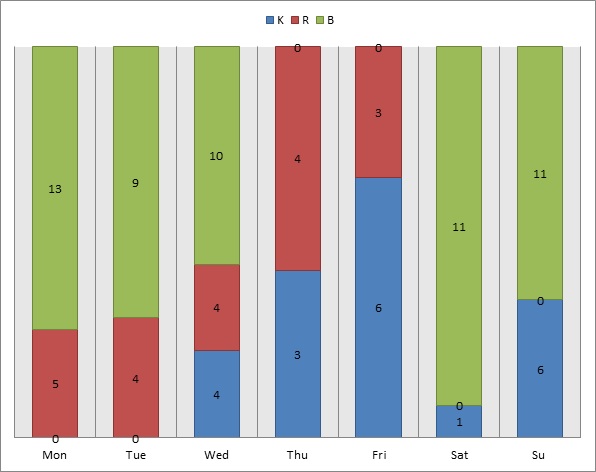
The distribution of complaints can be represented by the stacked diagram for different days in a week which is shown in the above diagram.
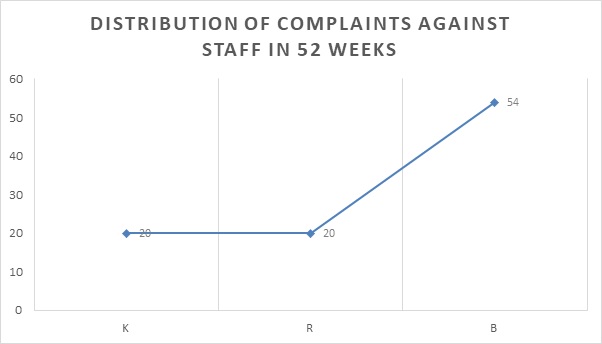
The distribution of Complaints against the staff members as a whole along with all the 52 weeks can be represented as follows when the individual distribution for different staffs is being also shown through the second diagram.
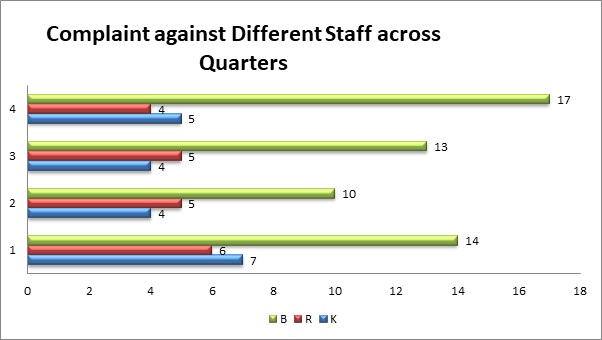
From the findings and results can be incorporated that in some with their number of complaint significant the low where is some other with the number of complaints were significantly high. On average it is been found that the number of complaints per week where 9 while the minimum number of complaints on a weekly basis is 1. The overall number of complaints was found to fluctuate every week as it is seen through the diagram and also the number of complaints the Fast and the fourth quarters respectively. On this regard, it is been found the other major reason behind this fluctuations was due to the staff members which were absent in some days and didn't able to record all the Complaints properly on a monthly basis of a weekly basis. There are different causes of the complaints but careful observation reflects the fact that the major cause for so many complaints from the consumers which lead to their dissatisfaction regarding the products and external services also was due to inappropriate performance of the staff members Basel and product. It is important to address these two issues as soon as possible in order to reduce the number of complaints received and improve the business performance of the organisation significantly over time.
5: Impact of this data and changes in the company’s procedures policy:
With the help of the process information in the form of data, I am able to understand the major causes behind the complaints and how they can be managed with operational effectiveness in order to improve the customer satisfaction level by rendering services to them in a significant manner. I have realised that it is important to take with the staff member Basel and talk about the ways through which she can improve her way of customer service providence. I will prefer to provide a special form of customer care training that will help to build new skills as well as will improvise the quality management policy of the company specifically putting much more focus on the quality of the product of my company. I will prefer to check the quality assurance and will address the issues related to improvement in quality and maintaining that quality throughout while conduction of the business.
6: Monitoring the level of Customer satisfaction:
I will prefer to set up new departments in order to address the customer complaints there should be new methodologies that will be applied in order to seriously and sincerely considered the customer feedback to online service as well as one on one conversations. With the help of these endeavours, I will be able to monitor the level of customer satisfaction in the future and followed by ensuring that the level of customer services is maintained with appropriate quality deliverance to the end consumers as required.
7: Data storage& Data protection:
My organisation will prefer to store the data in the newly established department which is coined with the complaint handling department. The department will be responsible for finding information and processing them in the form of data in order to enhance the operational effectiveness and serving the customers in a better way as per their necessity and requirement followed by ensuring that the storage of information, as well as data sets, are maintained security and with confidentiality. The privacy of the data it is essential to encrypt the information and secured them within the software by continuously updating the information and restricting the access only to the administrators handle the system with guest passwords. This will effectively help in assuring that the number of complaints received by the organization from the consumers is effectively handled as well as preserved. Moreover, this will help to reduce the number of complaints across the weeks and the department of complaint handling is able to monitor all of the activities as well as the accessibility of data regarding customer queries, feedbacks and responses significantly.
Conclusion
Customer service must be maintained in a systematic manner so that brand recognition expands on a global basis. Research analysis is done on customer services maintenance and customer satisfaction. It has been found that customer satisfaction is not attained as the product services of the company are very poor. Moreover, customers have shown their grievances on the organization during the questionnaire round. They stated that their complaints were totally ignored by the company and they continued to deliver poor services. It is also witnessed that the company has adopted various software to preserve the customers’ complaints and this has paved a new research way for the researcher to conduct further questionnaires through online platforms.
References
Behr, A. and Slater, D. (2019). How to protect intellectual property? 10 tips to keep IP safe. [online] CSO Online. Available at: https://www.csoonline.com/article/2138380/how-to-protect-intellectual-property-10-tips-to-keep-ip-safe.html [Accessed 21 Apr. 2019].
Gilliam, E. and Gilliam, E. (2019). 30 Best Customer Feedback Tools: an overview - Mopinion. [online] Mopinion. Available at: https://mopinion.com/30-best-customer-feedback-tools-an-overview/ [Accessed 21 Apr. 2019].
Goode, S., Hoehle, H., Venkatesh, V. and Brown, S.A., 2017. User compensation as a data breach recovery action: An investigation of the Sony PlayStation Network breach. MIS Quarterly, 41(3).
Technaprint.com. (2019). [online] Available at: http://www.technaprint.com/CSR_JobDescription.pdf [Accessed 21 Apr. 2019].
The Balance Careers.(2019). How to Develop Proper Metrics to Manage a Business's Performance. [online] Available at: https://www.thebalancecareers.com/you-can-t-manage-what-you-dont-measure-2275996 [Accessed 21 Apr. 2019].
Yadda.icm.edu.pl. (2019). [online] Available at: https://yadda.icm.edu.pl/baztech/element/bwmeta1.element.baztech-d32f115f-abac-4be1-a931-84a85bf48ab3/c/pea.Vol._14__No_1_-_05.2017.pdf [Accessed 21 Apr. 2019].
Appendix 1
- Analyse your data findings from the scenario provided?
- What are your findings from this data analysis? What impact will this data have on company?
- Explain the data analysis methods you used and how you have applied these methods e.g. quantitative, qualitative?
- Create a graphical representation of the data using MS Excel and insert your report.
Quantitative analysis
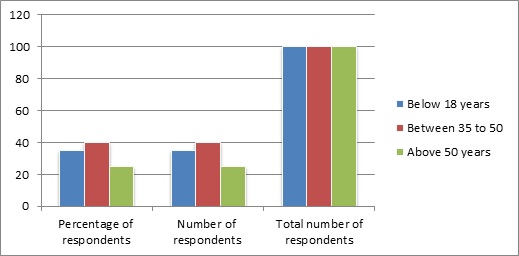
- What is your age?
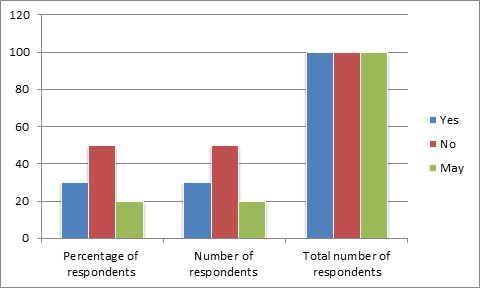
- Do you like to buy the product of this company?
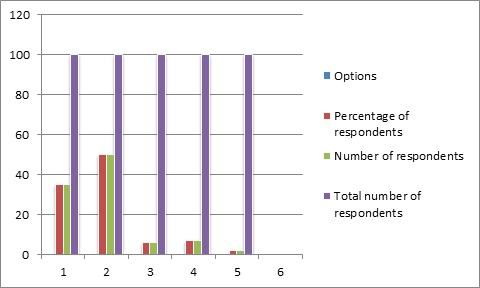
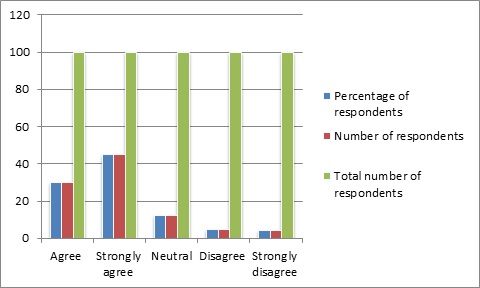
- How far do you agree that quality services must be implemented by every organization?
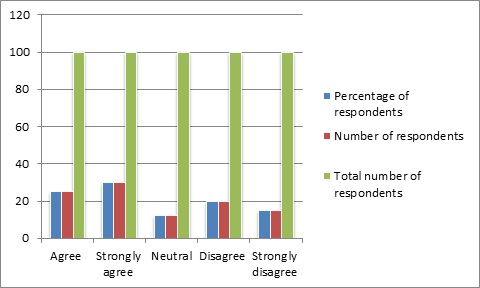
- How far do you agree that the company provides quality services?
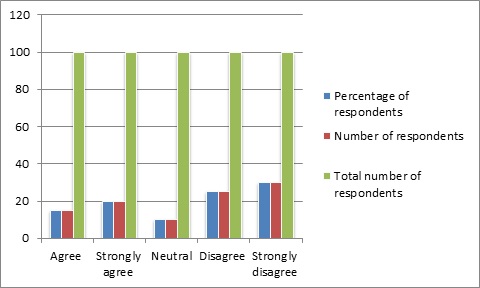
- How far do you agree that you are satisfied with the organization’s customer services?
- How far do you agree that customer services can enhance the company’s revenue stream?
Qualitative Analysis
- For how many years you are serving this company?
- What do you understand by service satisfaction?
- Is the company efficient to provide quality services to their customers?
- Do you believe that interaction with customers related to services can satisfy them?
- How important is customers’ feedback related to product services?
Appendix 2
- How will this organization monitor the levels of customer satisfaction in the future to ensure that their levels of customer services maintain a high level?
- Explain where would the organization store this formation for future references? Which departments would find this information useful for their operations? Should this data be stored securely? If yes, why?
- How might the organization store this data securely to protect their intellectual property?
- What policies and procedures may need to be updated as a result of your research findings?
- Reflective based question
- Do they agree on the outcome of your data analysis?
- Do they agree with your identified solution?
- What additional data finding would they recommend to be added to your findings?
- Ask them to provide feedback on your report layout and format for improvement recommendations
Resources
- 24 x 7 Availability.
- Trained and Certified Experts.
- Deadline Guaranteed.
- Plagiarism Free.
- Privacy Guaranteed.
- Free download.
- Online help for all project.
- Homework Help Services
Testimonials
Urgenthomework helped me with finance homework problems and taught math portion of my course as well. Initially, I used a tutor that taught me math course I felt that as if I was not getting the help I needed. With the help of Urgenthomework, I got precisely where I was weak: Sheryl. Read More

