BSBMKG507 Interpret Market Trends And Developments Task
Assessment Materials
BSBMKG507 Interpret market trends and developments
Task 1
Theory exam
Assessment Instructions
Task 1 is about using statistical analysis of market trends and developments in order to determine their potential impact on the organization. The statistical analysis will allow you to undergo qualitative analysis of comparative market information to evaluate organizational performance.
You must successfully answer all of the following questions. Click in the space provided and type your answer.
Central tendency
In technical terms, central tendency refers to the ‘typical’ or ‘central’ value of a set of values or data set. Measures of central tendency can be used to provide a single figure that gives you a quick, representative piece of information from a body of data. There are several varying ways of measuring this.
1. What are the three (3) central tendency measurement terms?
- Mode
- Mean
- Median
Calculating the mean age from a data set
2. Calculate the mean age of the customers from the following data set.
Data set: There are 4 customers, aged 34, 35, 36 and 39.
Please show your calculations.
Mean = 34 + 35 + 36 + 39 / 4 = 36
3. A group of music store customers buy a music DVD.
Their ages are as follows: 18, 19, 21, 20, 19, 18, 20, 18, 19.
- Calculate the mean age of this group of customers.
Please show your calculations.
18+19+21+20+19+18+20+18+19/9 = 19,11
- What would happen if one more customer, aged 79, buys the DVD as a gift for his granddaughter? How would you calculate the new mean age of the group of customers now?
Please show your calculations.
18+19+21+20+19+18+20+18+19+79/10 = 25,10
- If you want to identify your target market for DVD’s, in this case study, would it be a mistake to consider the mean as representative of your typical customers’ age? YES or NO? Please explain why.
Yes, because we have one person who is changing the target market because this person is an outlier.
4. What is ‘Outliers’? Please write a definition of “Outliers” in your own words.
Outlier is a point out of the curve. For example, if you have a set of data and only one is far away from the mean. An outlier is an information which is out of the normal average
Calculating the mean spending
5. Ten customers spend the following amounts in a music store:
$145 $50 $88 $75 $120 $115 $90 $68 $95 $105
How would you calculate the mean (average) spend for this group of customers?
Please show your calculations.
Average= 145+50+88+75+120+115+9-+68+95+105/10 = 95,10
Calculating the median
6. What is “the median”? Please write a definition of the central tendency measure “the median” using your own words.
Median is the exactly midpoint of a set of data.
7. Calculate the median of the following data sets.
Please show your calculations.
- First data set: 2, 4, 8, 12, 18, 26, 32, 41, 54.
N+1/2 – 9+1/2=5. It’s the 5th number in the set of data = 18
- Second data set: 2, 4, 8, 12, 18, 26, 32, 41, 54, 1000.
((N/2)+(n/2+1)) /2 – ((10/2)+(10/2+1)) /2. It’s the 5th and 6th number in the set of data divided by 2 = (18+26)/2 = 22
- What conclusions can you draw from the above median data sets scenario?
We can realize that the median is more resistant to outliers.
Calculating the mode
8. Calculating the mode
- What is “the mode”? Please write a definition of the central tendency measure ‘the mode’?
It is the value of the variable that occurs more often than any other value.
- Can you think of an original way to adapt the following data set to calculate the mode?
How would you calculate the mode?
Data set: Consider the number of items bought by shoppers in a clothing store in one day:
2 items were bought 15 times, 5 items were bought 8 times, 1 item was bought 10 times, 10 items were bought once, 3 items were bought 20 times, 4 items were bought 15 times and 7 items were bought 3 times.
Please show your calculations.
I would organize that as a table with 2 columns. And then would be easy to identify which one occurs more often. The mode is 3 items.
- How would you convert data (from b. above) in a frequency table. Describe what you
We could organize them in a crescent way of items to realize which one occurs more often. This file is not allowing me to paste or create a table here. I’ll attach an excel spreadsheet to this document.
- Explain the advantages of displaying your data as a histogram.
It allows an important feature of the data to become apparent.
Central tendency measures
9. Central tendency measures
A group of 50 customers had the following ages:
18 24 36 18 61 44 33 36 52 27
19 41 50 26 43 27 40 33 39 46
33 45 38 18 41 54 51 47 60 63
34 20 33 27 30 33 28 19 46 18
22 26 29 37 42 20 46 20 33 60
From this data, calculate the: a. Mode, b. Mean and c. Median ages of the customers.
Show your calculations.
- What is the Mode?
33 occurs 6 times
- What is the Mean?
(18 + 24 + 36 + 18 + 61 + 44 + 33 + 36 + 52 + 27 + 19 + 41 + 50 + 26 + 43 + 27 + 40 + 33 + 39 + 46 + 33 + 45 + 38 + 18 + 41 + 54 + 51 + 47 + 60 + 63 + 34 + 20 + 33 + 27 + 30 + 33 + 28 + 19 + 46 + 18 + 22 + 26 + 29 + 37 + 42 + 20 + 46 + 20 + 33 + 60) /50 = 35,7
- What is the Median?
25th and 26th = 33+34/2= 33,5
Dispersion methods
10. Dispersion methods
- Calculate the “range” of the following data set.
The data scores are as follows: 2, 3, 4, 6, 8, 20
Please show your calculations.
20-2 = 18
- Calculate the range a 2nd time – this time without the number 20. What is the range this time?
8-2 = 6
- What is an advantage and a disadvantage of using the range as a measure of dispersion?
Advantage It’s simple and easy
Disadvantage It’s not resistant to outliers.
Calculating the interquartile range
11. Calculating the interquartile range
- What does the interquartile range measure?
Examines the middle 50% of the data
- How would you calculate the interquartile range of data scores for the following data set: 2, 3, 4, 6, 8, 20
Please show your calculations.
I would calculate the median of the whole(Q2) set, and then the median of the 1st half (Q1) and then the median of the 2nd half(Q3). Q1= 2+4/2 = 3; Q2= 4+6/2=5; Q3= 8; Interquartile= Q3-Q1= 5
Task 2
Case Study
Assessment Instructions
Task 2 is about using statistical analysis of market trends and developments in order to determine their potential impact on the organisation. The statistical analysis will allow you to undergo qualitative analysis of comparative market information to evaluate organisational performance.
You must read and interpret the case study data in order to successfully answer all questions, and to research and analyse evidence for inclusion the final Market Research Report. Click in the space provided and type your answer for each question.
Case study scenario: Seaside Caravan Parks
Imagine you are the Marketing Manager for Seaside Caravan Parks. Seaside Caravan Parks have 6 sites located throughout Australia; they are a franchise operation with possible potential to expand internationally. Jane and John Smith are the new franchise owners of the Seaside Caravan Park at Wollongong NSW, they have contacted you, to requested that you develop a Market Research Report for them because they need to know the number of drive-in visitors to expect over the peak Christmas periods for 2013 and 2014.
Critical Evidence: You are required to evidence that you can apply a range of statistical techniques to analyse market trends and developments, current marketing performance and comparative market information; and document your analysis of market data including visual presentations of your findings.
Use the information in the chart below and follow the Research Procedures to assist you to develop your Market Research Report for the new franchise owners.
|
Seaside Caravan Park Wollongong |
2009 |
2010 |
2011 |
2012 |
2013 |
2014 |
|
Park capacity |
400 |
400 |
400 |
400 |
450 |
450 |
|
Existing bookings |
300 |
310 |
320 |
330 |
341 |
352 |
|
Sites booked by drive–in visitors for the period 26 December till 2 January |
65 |
70 |
76 |
70 | ||
|
Booking from families |
25 |
25 |
26 |
24 | ||
|
Bookings from couples |
38 |
42 |
45 |
42 | ||
|
Bookings from individuals |
2 |
3 |
5 |
4 |
Research procedures
Note: You may discuss the Wollongong Seaside Caravan Park case study during class. However, please note that completion of questions below is an individual activity.
1. What information can you find and analyze from the existing data?
We can find information about the past of the Seaside Caravan Park with their customers. The internal information we can find that the park Capacity has increased and the external is everything else: Bookings, booked by drive-in, Booking from families, couples and individual. We also can find that the parking capacity has reached its maximum in 2012.
2. What information can you forecast for 2013?
We can forecast the Existing Bookings, Drive-in bookings, Bookings from Families, Couples and Individuals.
3. Considering the increased number of sites available in 2013 onwards…
- How would the need for the increase in sites have been determined?
Was determined by the demand for that service, as it was raising every year.
- What type of extra facilities would the park need to implement to cater for the increased sites; and how would you determine these needs?
Parking, BBQ, Toilets. By Benchmarking, trend analysis and best practice.
- What information would have enabled these needs to be determined?
They have two options: analyze their competitors or look into their franchise handbook.
4. How would you obtain qualitative primary data to identify over-performing and under-performing facilities and services to be considered for redevelopment or withdrawal at Seaside Caravan Parks? And who would you involve in this research process?
I need to do a survey with the customers to understand what are their needs. It’s also important to gather internal information with our stakeholders, what do they believe we need to improve so we can raise our business.
5. A competitor has opened in close proximity to the Wollongong Seaside Caravan Park.
Being an innovative and progressive company, Seaside Caravan Parks has constantly monitored and analyzed its statistical data. Why would you monitor and analyse statistical data? How would you utilize this data?
Understanding our competitors is so important in order to keep innovating. It’s important to analyze statistical data because we can use that to make decisions and to understand our customers.
Forecasting techniques
6. Forecasting techniques
Demonstrate use of the least squares method. Using the time series data from the Wollongong Seaside Caravan Park, forecast the number of drive-in visitors to expect over the peak Christmas periods in 2013 and 2014.
Show your calculations. Create a series of MS excel spreadsheets to show your formulas and methods of calculating the number of drive-in visitors to expect over the peak Christmas periods in 2013 and 2014 using the least squares method.
2013 – 87; 2014 – 92 – Calculations Attached in the spreadsheet.
7. Other forecasting techniques
- What are 4 other forecasting techniques Seaside Caravan Parks could utilise?
- Growth Rate
- Scenario Analyses
- Correlation Analyses
- Surveys
- Choose two (2) of these other forecasting techniques. How you would utilise these forecasting techniques to identify existing and emerging market trends at Seaside Caravan Parks.
- Growth Rate: I would plot all the information in graphs to figure if we have an outlier. Then I’d check if is there any pattern of growth, after confirm that I would calculate the Growth Rate and apply that on the next future years.
- Correlation Analyses: I would try to find correlation between some variables and explain that after using a few statistical methods.
8. How might you communicate the following to a small business like Seaside Caravan Parks:
- The importance of forecasting and
- How it affects their organization
What would you say?
There is no crystal ball that can predict exactly what’s
going to happen, no one can predict what the market will do. But we do have some techniques that can help us to understand what is happening right now in order to keep innovating and keep with our customers. We can forecast and plan the future even though we know that is impossible to predict it. But it’s better we have a plan for what is coming than if we just do things to solve problems. That’s why you need a forecasting marketing professional to help you to understand your target market and your industry in order to make strategic decisions.
Report on Market data
It is important to ensure that your audience is able to easily understand the results of your analysis and see the significance. Achieving this objective in any form of presentation will require effective use of visuals and clear explanation of data to make your message clear.
9. Prepare, plot and interpret data
- How could you visually present statistical data to Seaside Caravan Parks? Can you compile a list of several options? Write the names of these options.
I can use graphs and charts to present these data visually. Column chart, bar chart, pie chart, line chart, multiple line graphs, area chart are the most common way to present data. In this situation, I’d present the Seaside Caravan Parks data with a Bars and Line Chart.
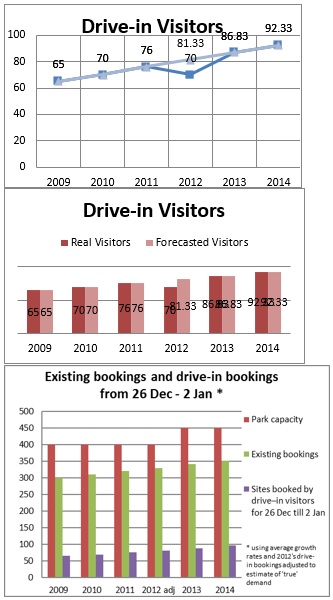
- From your list of options, prepare a minimum of two (2) graphic visuals presenting your Seaside Caravan Parks statistical data forecasting the number of drive-in visitors to expect over the peak Christmas periods in 2013 and 2014.
- Now you need to explain the results and your analysis – not just repeat your findings.
Write a summative report with your interpretation of the data, which you could give to relevant personnel to study and discuss.
After analyzing the graph, one can see that the reason why the seaside caravan park did not have more costumers in 2012 is because they had reached their maximum capacity. That was also the reason that the park decided to expand from 400 to 450 spots. Even though the driving in visitors had a small decrease there was a full reach on the pre booking
10. How would you assess your visual presentation for potential problems, and take any necessary corrective action?
Plot it into graphs and look at that to realize if we have any outlier. And estimate beforehand just to make sure that we have no surprises and I’m not misleading anything.
11. Create an action plan outlining issues to follow up on with the new franchisees.
Research new ways to increase customer satisfaction, expand caravan site, introduce new ways of entertainment for park users, upgrade facilities, research cost of innovation.
12. Compile a list of the relevant legislation that may affect aspects of the Seaside Caravan Parks business operations.
How would you monitor key provisions of relevant legislation from all forms of government, codes of practice and national standards that may affect aspects of your business operations?
|
The Holiday Parks (Long-term Casual Occupation) Act 2002 |
|
Residential Parks Act 1998 |
|
Corporations Act |
|
There is a Fair Trading Act in every state, including NSW |
Task 3
Market Research Report
You must now develop your Market Research Report for Jane & John Smith at the Seaside Caravan Park in Wollongong NSW. Elaborate on your research results and your market analysis at Q1-Q12 from the above Research Procedures. Follow the Market Research Report format and refer to the directives in the Student workbook at pages 88 & 89 for help completing your report.
[The Market Research Report template is supplied on the following page]
PLEASE PASTE YOUR ASSESSMENT TASK 3 (Market Research Report) BELOW THIS LINE
You can use the template provided below.
Market Research Report [template]
BSBMKG507 Interpret Market Trends And Developments Task page
[The title page should gain the immediate attention of the reader. The title should be clearly displayed, positioned highly on the page to accurately reflect the report’s content. Ensure the relevant information such as author and date is included.]
Executive Summary
[Often the summary will be the only content a manager will take the time to read.
Ensure the summary concisely contains all the relevant information and is placed at the beginning of the report.]
Introduction and Terms of Reference
[This should be concise, set the scene and inform the reader of the details at the start of the project.]
Methodology
[The reader needs to know how and by what methods you have reached your conclusions. Typical methodology should cover: the type of equipment and software used; the conditions of research undertaken; the assumptions made in the research.]
Results
[Tables and charts need to present the data findings to enable the reader a greater understanding of your conclusions and to provide evidence that illustrate your findingsto be true.
Data may include: charts; curves; graphs; spreadsheets.]
Discussion and analysis
[This section of the report is the most important and largest. Rather than repeat your findings you need to explain the results and your analysis.
It is recommended that you write your analysis of results section in the early stages to allow yourself more time to collect relevant data as you write the other areas of the report.]
Conclusions
[Conclusions should be clearly stated and assess the implications of your previously presented evidence.]
Recommendations
[Recommendations should be drawn from your conclusions in a clear and concise manner.
An action plan outlining issues to follow up on should be provided for your readers.]
Appendices
[Appendices may contain detailed or supplementary information. Removing these issues from the main text allows the reader to follow the main issues free from distraction.]
[Please remember to delete the directives before submitting your final Market Research Report. Failure to do this may result in a resubmission.]
Market Research Report
January 2017
1. Executive Summary
Seaside Caravan Park in Wollongong NSW it is a company that is raising their reach and starting to growth as a franchise. This research was done in order to forecast your future and help you to decide what are your next steps to keep growing your business.
We used two technique to forecast the number of Drive-in visitors in 2013 and 2014. One is simple and uses a growth rate to forecast the next numbers. The other one is called Leas Squares Regression and it’s a statistical tool to forecast, using complex calculations to forecast in a mathematic way.
2. Introduction and Methodology
Seaside Caravan Parks have 6 sites located throughout Australia; they are a franchise operation with possible potential to expand internationally. Jane and John Smith are the new franchise owners of the Seaside Caravan Park at Wollongong NSW, they have contacted you, to requested that you develop a Market Research Report for them because they need to know the number of drive-in visitors to expect over the peak Christmas periods for 2013 and 2014.
Growth rates refer to the percentage change of a specific variable within a specific time period, given a certain context. For investors, growth rates typically represent the compounded annualized rate of growth of a company's revenues, earnings, dividends and even macro concepts such as GDP and the economy as a whole. Expected forward-looking or trailing growth rates are two common kinds of growth rates used for analysis.
The method of least squares is a standard approach in regression analysis to the approximate solution of overdetermined systems, i.e., sets of equations in which there are more equations than unknowns. "Least squares" means that the overall solution minimizes the sum of the squares of the errors made in the results of every single equation.
3. Terms and references
We used as references all the information we had, which was:
- Parking capacity from 2009, 2010, 2011, 2012, 2013 and 2014;
- Existing bookings from 2009, 2010, 2011 and 2012;
- Sites booked by drive–in visitors for the period 26 December till 2 January from 2009, 2010, 2011 and 2012;
- Bookings from families;
- Booking from couples;
- Booking from individuals.
We had no considered competitors, we haven’t used any market research or external data. The whole research was done based on the information in the table below.
|
Seaside Caravan Park Wollongong |
2009 |
2010 |
2011 |
2012 |
2013 |
2014 |
|
Park capacity |
400 |
400 |
400 |
400 |
450 |
450 |
|
Existing bookings |
300 |
310 |
320 |
330 |
341 |
352 |
|
Sites booked by drive–in visitors for the period 26 December till 2 January |
65 |
70 |
76 |
70 | ||
|
Booking from families |
25 |
25 |
26 |
24 | ||
|
Bookings from couples |
38 |
42 |
45 |
42 | ||
|
Bookings from individuals |
2 |
3 |
5 |
4 |
4. Results
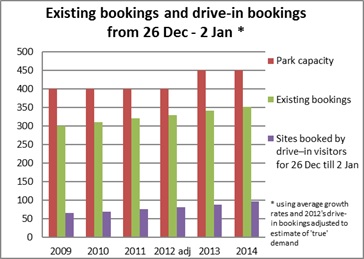
Using two forecast techniques we have found the information in the graphs below:
Using the average growth rate technique, we found the following figures:
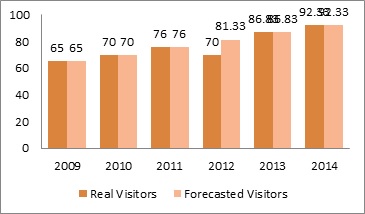
Least Square Methods we found the following data:
forecaste for the years of 2015 and 2016 using the Least Squares Method
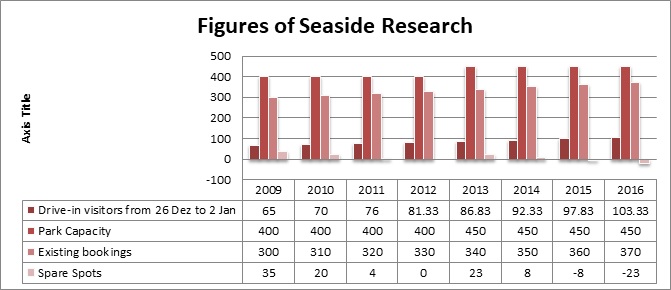
it has been calculated also a variable called Spare Spots, which is the Park Capacity minus Existing Bookings and the Drive-in bookings in the busy week. And what we figure out is that if you haven’t invested in more facilities for 2013, you would probably have to send more visitors home then you might have sent in 2012, according with our forecast data.
5. Conclusions and Recommendations
To finish this report, we have to go through this graph below again
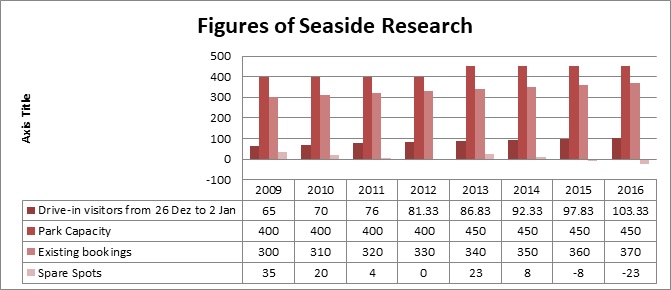
After analyzing the data on the graphs it is clear that the Seaside caravan park is growing and that expanding would be a smart business move. A clear fact that can be seen is that the reason that in 2012 there was a lost of profit opportunity was because the park was at its full capacity during their busiest weeks. Once the park owners realized that and invested from 400 to 450 occupants for the upcoming years. It can also be seen in the graphs that at this growth rate the park will be in need to expand again the upcoming years. Just by the figures analyzes it can for see that in 2016 there will be 23 more spots required. However expanding the business will not be easy. There will be a lot of work involved. New staff to be hired, a raise in the fixed cost of the park and the cost of the renovations that will need to take place. That can all be done properly thru the use of benchmarking and contacting the franchise to figure out costs and also get ideas for the future renovations. After getting that figure out and all the approval from local council man, Seaside caravan park can expand their business and allocate a lot more customers.
Buy BSBMKG507 Interpret Market Trends And Developments Task Answers Online
Talk to our expert to get the help with BSBMKG507 Interpret Market Trends And Developments Task to complete your assessment on time and boost your grades now
The main aim/motive of the management assignment help services is to get connect with a greater number of students, and effectively help, and support them in getting completing their assignments the students also get find this a wonderful opportunity where they could effectively learn more about their topics, as the experts also have the best team members with them in which all the members effectively support each other to get complete their diploma assignments. They complete the assessments of the students in an appropriate manner and deliver them back to the students before the due date of the assignment so that the students could timely submit this, and can score higher marks. The experts of the assignment help services at urgenthomework.com are so much skilled, capable, talented, and experienced in their field of programming homework help writing assignments, so, for this, they can effectively write the best economics assignment help services.
Get Online Support for BSBMKG507 Interpret Market Trends And Developments Task Assignment Help Online
Resources
- 24 x 7 Availability.
- Trained and Certified Experts.
- Deadline Guaranteed.
- Plagiarism Free.
- Privacy Guaranteed.
- Free download.
- Online help for all project.
- Homework Help Services
Testimonials
Urgenthomework helped me with finance homework problems and taught math portion of my course as well. Initially, I used a tutor that taught me math course I felt that as if I was not getting the help I needed. With the help of Urgenthomework, I got precisely where I was weak: Sheryl. Read More

