B9AC106 Financial Analysis Sample Assignment
Analysis of Financial Statements
Introduction
SuperGroup PLC is the owner of SuperDry PLC, a multinational clothing company based in UK. The concern has its headquarters in Cheltenham with numerous showrooms all over the world. Established by Julian Dunkerton and Ian Hibbs as “Cult Clothing Co.” in 1985, the company expanded in 1990s and opened its first “SuperGroup” store in Covent Garden in 2004. Presently, SuperGroup PLC is listed on the London Stock Exchange and is a component of FTSE 250 Index.
The following report will provide an analysis of the financial statements of SuperGroup PLC. This report provides a detailed discussion of financial performance and financial position of the company. For this purpose, we have calculated the entity’s financial ratios for last three financial years in order to identify and assess any trends and compare them with that of its competitors and the industry. This report also includes a recommendation for the company to improve its functioning in coming years. In addition to this, the value of 15% shares of the SuperGroup PLC has been calculated using two different valuation methods for the purpose of acquisition. The report ends with an examination whether investments in the shares of SuperGroup PLC will guarantee maximum returns with minimum risk.
Answer 1
Computation of Financial Ratios
|
Statement showing Financial Ratios of SuperGroup PLC | |||
|
Particulars |
2015 (£m) |
2016 (£m) |
2017 (£m) |
|
Debt (Total Debt) |
124.6 |
46 |
124.6 |
|
Equity |
295.2 |
511 |
372.4 |
|
Debt to Equity ratio |
0.42 |
0.09 |
0.33 |
|
Current Assets |
266.2 |
109.7 |
340.1 |
|
Current Liability |
92.8 |
45.8 |
132.1 |
|
Current Ratio |
2.87 |
2.4 |
2.57 |
|
Current Assets (excluding Inventory) |
158.3 |
108.4 |
182.9 |
|
Current Liability |
92.8 |
45.8 |
132.1 |
|
Acid test Ratio |
1.71 |
2.37 |
1.38 |
|
Net profit |
48.4 |
41.3 |
68.7 |
|
Total Assets |
419.8 |
557 |
552.8 |
|
Return on Total Assets |
11.53 % |
7.42 % |
12.43 % |
|
Net profit |
48.4 |
41.3 |
68.7 |
|
Revenue |
486.6 |
597.5 |
752 |
|
Net Profit Margin |
9.95 % |
6.91 % |
9.14 % |
Interpretation of Financial Ratios
Analysing financial ratios is vital for comparing the financial position and financial performance of a company with the industrial trends and with the performance of its competitors.
Following is a detailed study of the computed financial ratios for critical evaluation of the financial position and financial performance of the SuperGroup PLC. The study is conducted with a view to ascertain whether or not its performance will benefit the stakeholders of the company and maximise their wealth.
1. Debt to Equity Ratio
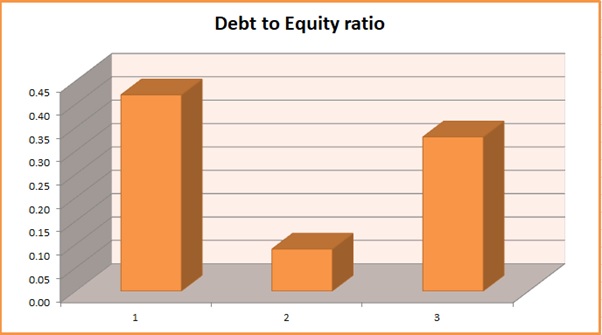
Debt to equity is one of the most common and widely used financial tools for a concise comprehension of a company’s present liquidity position. Debt to equity ratio helps the stakeholders determine whether an organization prefers external sources of capital instead of shareholders’ fund and by this means compounding the risk factor for them.
In case of SuperGroup PLC, the trends in debt to equity ratio are quite clear. The ratio was 0.42 in the year 2015, which is much better than ideal debt to equity ratio. Later, the SuperGroup depleted to merely 0.09 in 2016, but then improvement and rose to 0.33 in 2017. This indicates that compared to 2016, SuperGroup PLC has decided to increase the share of external debt in its total capital structure. This strategy adopted by the management team of SuperGroup PLC can have two outcomes. First, it will reduce the general cost of capital since the cost of internal capital like equity and preference share is much more than the cost of debt. Hence, if we calculate the weighted capital cost, we will see total cost of such capital rised significantly in 2016, and shrunk again in 2017.
On the other hand, a low debt to equity ratio infers that SuperGroup PLC has a remarkable liquidity as it gives preference to internal sources of capital. This not only reduces the risk for minority shareholders of SuperGroup PLC, but also helps in evading the economic burden which is induced by higher external debt segment.
2. Current Ratio
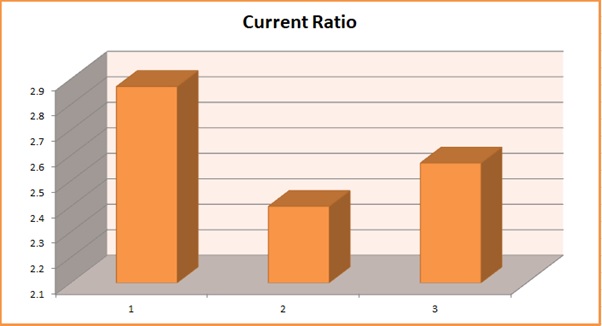
Current ratio can be describes as a tool to measure a company’s ability to meet its short term liabilities. It is calculated by dividing the total assets by total liabilities and is used by the stakeholders to determine if a company holds adequate current assets to meet any short term obligation which may arise in the routine course of business.
From the above graph we can notice that SuperGroup PLC’s current ratio fell from 2.87 in 2015 to 2.4 in 2016. And then it rises up to 2.57 in 2017 again. The company has been able to maintain this ratio better than the ideal ratio of 2:1. The improvement in current ratio in 2017 shows that SuperGroup now has more liquid assets than its short term obligations than the last year. However, a current ratio as high as 2.57 also signifies SuperGroup has a large amount of liquid funds which are blocked due to working capital requirements.
This is disadvantageous for all the stakeholders who invest in the company to earn higher return rates than what risk-free investment schemes offer. This shows that a large amount of funds are being underutilized by SuperGroup PLC. The firm should optimally use its excess liquid funds to achieve its organisational goal, i.e. to maximise the earnings of its owners.
3. Acid test Ratio
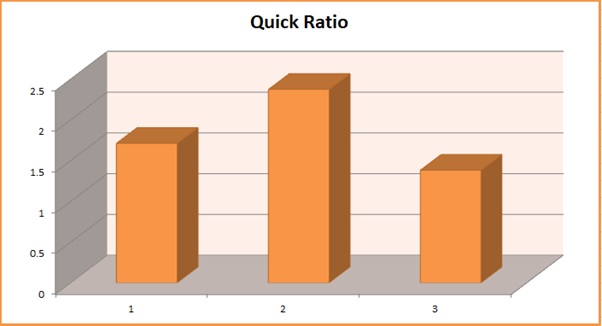
Acid test ratio, or quick ratio, is similar in purpose to current ratio. Acid test ratio is also a indicator of the short term liquidity of an organization, but considers only those current assets which can be converted into liquid funds at the earliest. In simpler terms, acid test ratio excludes the inventories and any prepaid expenses from current assets before dividing it by the current liabilities.
It is evident from the graph given above that SuperGroup PLC is aiming at utilise its funds in the most optimal manner. It rose from 1.71 in 2015 to 2.37 in 2016, and then fell back to 1.38 in 2017. For the past three years, SuperGroup PLC has been maintaining acid test ratio better than ideal one. Although, the ratio in 2016 indicated that SuperGroup had a large amount of underutilised funds blocked by working capital, the company managed to bring it down while ensuring it doesn’t fall too much. This move of SuperGroup PLC can be expected to bring higher returns to stakeholders of the company in future years.
4. Return on Total Assets
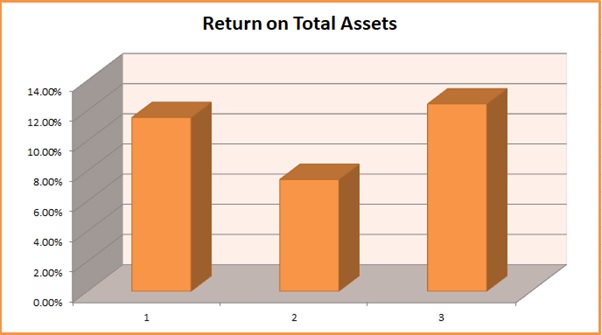
Return on total assets is the percentage of the net profit earned by the company to the value of total assets, both non - current and current assets, owned by it. Return on total assets is used to analyse the effectiveness and efficiency with which management utilises long term and short term assets of the company in order to generate revenue and profits for maximising the wealth of its stakeholders.
In case of SuperGroup PLC, it can be seen that return on total assets increased almost 1.7 times from 7.42 % in 2016 to 12.42 % in 2017. This is also the company’s highest rate of return on total assets for last 10 years of its operations. The rise in this rate indicates that net profits after tax of SuperGroup PLC have increased in greater proportion to the rise in its total assets. The further assets acquired in 2017 have been used in more optimal way than preceding years. The rate fell down by a whopping 4.11 % from 11.53 % in 2015 to 7.42 % in 2016, but made a comeback and improved by 5.01 % in 2017 rising to 12.43 %. It should also be noted that the net profits of the company have increased by more than 50 % despite a fall in total assets owned by the SuperGroup PLC. All things considered, the financial performance of SuperGroup PLC in terms of improvement in return on total assets in 2017 has been pleasing for its stakeholders, and the management should try to maintain this rate in coming years.
5. Net Profit Margin
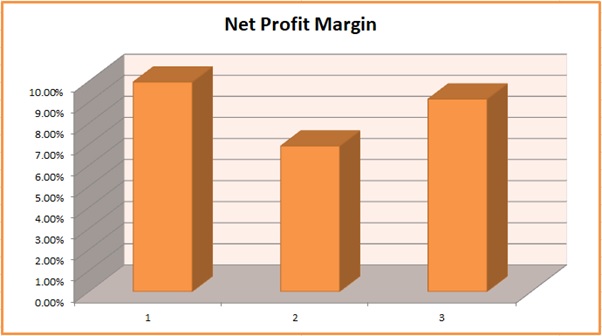
Net profit margin shows the percentage of profit earned with respect to the total revenue generated from operations of a company. The stockholders anticipate a rise in profitability of the company they invest it long run. This rise in profitability is exhibited by a rise in net profit margin.
The net profit margin of SuperGroup PLC follows the same trend as its return on total assets. It fell down from 9.95 % in 2015 to 6.91 % in 2016, and then increased to 9.14 % in 2017. This shows that net profit margin of SuperGroup PLC are unstable and do not have a specific direction. Hence, the profitability of SuperGroup is also unpredictable for upcoming years. Though, the improvement in margin in 2017 is a good indicator since it rose by more than 33 %. The management of SuperGroup PLC should aim at increasing the profit margin steadily to attract more investors and benefit them in long run.
Examination and Comparison of Key Competitor Next PLC’s Ratios and Industry Norms
|
Statement showing Financial Ratios of Next PLC | |||
|
Particulars |
2015 |
2016 |
2017 |
|
Debt to Equity Ratio |
6.47 |
3.71 |
4.31 |
|
Current Ratio |
1.41 |
2.29 |
1.96 |
|
Acid test Ratio |
0.98 |
1.67 |
1.43 |
|
Return on Total Assets |
28.61% |
26.42% |
23.10% |
|
Net Profit Margin |
15.96% |
15.51% |
14.60% |
1. Debt to Equity Ratio
As evident from the above table, unlike SuperGroup, Next PLC prefers having a greater share of external debt in comparison to share capital in its capital structure. Lowest debt to equity ratio of Next PLC has been 3.71 in 2016, which is still more than double the highest debt to equity ratio of SuperGroup PLC. While this shows that Next PLC’s weighted cost of capital is much lower than that of SuperGroup, the capital structure of Next PLC lacks in liquidity. The standard debt to equity as per industry norms is also fairly low high at 1.86. However, if SuperGroup is able to deal with higher cost of its capital structure, then it shouldn’t try to match with industrial norms. Greater debt to equity ratio in industry also shows lower liquidity.
2. Current Ratio
The current ratio of Next PLC was quite low in 2015 at 1.41. But it rose to 1.97 now in 2017. This indicates that Next PLC has been utilising its excess funds instead of keeping it blocked in working capital. The industrial norm for current ratio is 1.61. On the other side, the current ratio of SuperGroup is still very high. This shows that even though SuperGroup has enough funds available to meet short term obligations, it has caused blocking of a large amount of liquid funds which should be utilised for more profitable purposes.
3. Acid Test Ratio
The trend in acid test ratio of Next PLC is similar to its current ratio trend. Unlike SuperGroup, Next PLC continuously invests its surplus liquid resources to ensure they are not underutilised due to blockade in working capital. The acid test ratio of Next PLC has increased from 0.98 in 2015 to 1.43 in 2017. Whereas, in the case of SuperGroup, acid test ratio rose to 2.37 in 2016 but then fell back to 1.38 in 2017. When compared to the industrial norms of 0.97, Next PLC and SuperGroup PLC’s acid test ratio indicate a higher liquidity than the industry average, but also attest that surplus funds are blocked in their working capital.
4. Return on Total Assets
The amount of investment required in clothing industry is much lower than other industries. Therefore the return on total assets is also quite high in this industry with an average of 20.8%. Even though the return on total assets of Next PLC is much higher than industrial norms, it has been following a downward trend for last few years. Comparatively, SuperGroup PLC’s returns on total assets have not only been poorer than industrial norms, but also inconsistent.
5. Net Profit Margin
The net profit margin of both Next PLC and SuperGroup PLC follow the same trend as their return on total assets. While Next’s net profit margin for 2017 was 14.60%, SuperGroup’s net profit margin was merely 9.14%, with industrial average at 12.33%.
Answer 2
Recommendation to SuperGroup PLC
As stated before, the return on total assets and net profit margin of SuperGroup PLC are not only inconsistent, but also below the industry average. Despite the fact that debt to equity ratio and current ratio of SuperGroup are satisfactory, the management must focus on improving the productivity of company to ensure its survival.
I recommend SuperGroup to use its excess resources lying underutilized in the form of current assets to increase its profitability. Surplus funds and resources should be invested in more effective and efficient manner so that SuperGroup PLC’s profitability corresponds with that of the industry norms and the wealth of stakeholders can be maximised.
SuperGroup PLC needs to analyse its existing working capital requirements to withdraw surplus funds which can be invested in other revenue generating plans and policies. The company must not let go any prospect to improve its profitability. The money invested by owners of the company should be employed in a way that maximises their returns. Excess funds should not be kept ideal.
SuperGroup should also consider changing its capital structure. A low debt to equity ratio safeguards the liquidity of the company, but it also involves higher cost of capital. A company’s capital structure must be planned to not only to maintain liquidity, but also for maximising earning per share. Hence, SuperGroup PLC should adopt a reasonable policy to reframe its capital structure and follow the industrial norms.
Impact of Recommendation on Financial Ratios
The purpose of financial ratios is to display the effects of policies adopted the management of the company on its financial performance and financial position. As a result, analysing these financial ratios also enable the investors to calculate the risk involved and profitability of the entity. The recommendation given above to SuperGroup PLC can have following impact on its existing financial ratios:
1.Liquidity Ratios (Current Ratio and Acid Test Ratio):
Since there are abundant funds in the working capital of SuperGroup, utilizing them for other profitable purposes won’t affect the liquidity of the company. SuperGroup will still have enough liquid assets to meet its short term obligations. Yet, SuperGroup should be careful that the total current liabilities do not exceed current assets of the company.
2. Debt to Equity Ratio
As notices earlier, SuperGroup has a very low debt to equity ratio with the amount of long term debt almost negligible. The effect of recommendation on debt to equity ratio of SuperGroup PLC will be negligible. While equity has a higher capital cost, external debt is a viable source of finance. However, it creates a burden of fixed and timely repayment of both interest and principal.
3. Return on Total Assets
The net profits of SuperGroup have increased considerably in last year despite a fall in total assets of the company. However, the net return on assets of SuperGroup PLC show great inconsistency over the years. If the managements accepts the recommendation put forward, the profitability of company will improve and consequently return on total assets will also improve.
4. Net profit margin
The trend in net profit margin of SuperGroup is similar to its return on total assets. While there have been remarkable improvement in last year, the net margin is still inconsistent. Thus, if resources of SuperGroup PLC are used efficiently and effectively, it will improve the net profit margin of company; and also tally with industry norms in long run.
Answer 3
Price to Earnings Method
In Price to Earnings Method, the shares of a company are valued on the basis of their market value. This market value is determined by multiplying the average price to earnings (P/E) ratio of the industry with its profits.
The average price to earnings ratio of the clothing industry is 18.51 and net profit after tax of SuperGroup PLC in 2017 is £ 68.7 million.
|
Valuation of 15% Stake in SuperGroup PLC | |
|
Particulars |
Amount (£m) |
|
A. Net Profit |
68.7 |
|
B. Market Value of Shares (A x 18.51) |
1271.64 |
|
Valuation of 15% stake (B x 15%) |
190.75 |
Market to Book Value Method
Market to Book Value is a method used for the purpose of calculating market value of shares of a company during acquisition. As the name suggests, this method uses the proportion of market value and book value of shares.
The market value of SuperGroup PLC is £ 907 million and book value as on 2017 is £ 372.4 million.
|
Valuation of 15% Stake in SuperGroup PLC | |
|
Particulars |
Amount (£m) |
|
A. Market Cap |
907 |
|
B. Book Value |
372.4 |
|
C. Market to Book Value Ratio (A/B) |
2.436 |
|
D. 15% Stake Value (B x 15%) |
55.86 |
|
Valuation of 15% stake (C x D) |
136.075 |
Analysis of the Valuation Methods
Both methods used for the purpose of valuation of 15 % stake in SuperGroup PLC rely on data from official website of London Stock Exchange (accessed June 27, 2018) and the annual reports of Supergroup PLC for 2017.
In price to earning method the stock is valued on the basis of earning capacity of SuperGroup PLC and its capability to generate wealth for its stakeholders. On the other hand, in market value to book value method, a proportion of market value and book value of total shares of SuperGroup PLC is determined. Using two different methods assists the acquirer organization to verify that the value of company is not underestimated or overestimated owing to the factors of stock market.
Answer 4
The analysis of financial statements of SuperGroup PLC using financial ratios shows that the performance of company has been fluctuating. The company has a very low debt segment in its capital structure which shows that SuperGroup values its owners and aims at maximising their wealth. However, its profit levels are not satisfactory to attract any investments.
SuperGroup PLC has maintained adequate current and acid test ratio which shows that it has sufficient resources to meet current its short term obligations. Yet, these ratios are much higher than the industrial norms; a large portion of company’s liquid funds are underutilised as they are blocked within company’s working capital. Both net profit margin and return on total assets of SuperGroup PLC are inconsistent and do not follow a certain trend.
Taking into account above points, I would NOT recommend my relative to invest in SuperGroup PLC. While there are numerous prospects for growth of the company in long term, it is not profitable for an elderly to invest in SuperGroup PLC if he wants to minimise his risk and maximise his income.
The capital structure of SuperGroup PLC proves that the risk is much lower than other companies in the industry due to liquidity of the firm. Yet, the recent fluctuations in profits of SuperGroup PLC make it unfit for steady returns in short term. Thus, I recommend that the relative should not invest in SuperGroup PLC.
References
SuperGroup PLC (2018). Annual Report 2017. [online] pp.104-108.
SuperGroup PLC (2018). Annual Report 2016. [online] pp.97-101.
Reuters. (2018), SuperDry PLC (SDRY.L). [online] Reuters. Available at: https://www.reuters.com/finance/stocks/overview/SDRY.L [Accessed 28 Jun. 2018]
investing.com UK. (2018). Next PLC (NXT) Financial Ratios. [online] Available at: https://uk.investing.com/equities/next-ratios [Accessed 28 Jun. 2018]
Barnes, Paul (1987), The analysis and use of financial ratios: A review article, Journal of Business, Finance and Accounting 14, 458–462.
Barker, Richard G. (1999), The role of dividends in valuation models used by analysts and fund managers, European Accounting Review 8, 203–209.
Fülbier, R.U., Silva, J.L. & Pferdehirt, M.H. Schmalenbach Bus Rev (2008) 60: 122
Warren, C.S. and Jones, J., 2018. Corporate financial accounting. Cengage Learning., 26-29
Friedlob, G. and Schleifer, L. (2003). Essentials of financial analysis. New York: J. Wiley, 19-22
Buy B9AC106 Financial Analysis Answers Online
Talk to our expert to get the help with B9AC106 Financial Analysis to complete your assessment on time and boost your grades now
The main aim/motive of the management assignment help services is to get connect with a greater number of students, and effectively help, and support them in getting completing their assignments the students also get find this a wonderful opportunity where they could effectively learn more about their topics, as the experts also have the best team members with them in which all the members effectively support each other to get complete their diploma assignments. They complete the assessments of the students in an appropriate manner and deliver them back to the students before the due date of the assignment so that the students could timely submit this, and can score higher marks. The experts of the assignment help services at urgenthomework.com are so much skilled, capable, talented, and experienced in their field of programming homework help writing assignments, so, for this, they can effectively write the best economics assignment help services.
Get Online Support for B9AC106 Financial Analysis Assignment Help Online
Resources
- 24 x 7 Availability.
- Trained and Certified Experts.
- Deadline Guaranteed.
- Plagiarism Free.
- Privacy Guaranteed.
- Free download.
- Online help for all project.
- Homework Help Services
Testimonials
Urgenthomework helped me with finance homework problems and taught math portion of my course as well. Initially, I used a tutor that taught me math course I felt that as if I was not getting the help I needed. With the help of Urgenthomework, I got precisely where I was weak: Sheryl. Read More

