Analysis of Marketplace Confidence Sample Assignment
Analysis of Marketplace confidence
Dear Bendigo City Council,
Thank you for the opportunity to assist you in the analysis of business data from your regional area. I have presented a summary below in response to the questions you posed.
1. Annual gross revenue in the Bendigo region:
- The annual gross revenue of the 150 businesses surveyed ranged from $48,300 to $29,395,440 with an average of just $439,675. There was a fair amount of variation in the revenue of the businesses surveyed, with a difference of more than $29 million between the largest and smallest revenues. There were a significant number of businesses at the lower end of the scale, with 84% of business grossing less than $6,000,000 in revenue annually and almost 25% generating less than $100,000. There were a few unusual results at the top end of those surveyed. Based on standard measures, revenues exceeding about $8.6 million are considered to lie outside the norm.
- The average annual gross revenue of the businesses surveyed is $439,675. Assuming the data supplied is representative of all 5,500 registered businesses, total annual revenue in the Bendigo region is $2,418,212,500.
2. Influence of having a business plan on gross revenue:
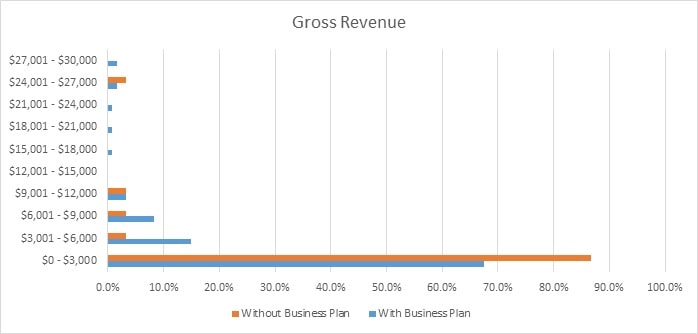
- The data does not support the proposition that having a business plan has any material effect on gross revenue. Overall, there is no significant difference in revenue results between businesses that have a business plan and those that do not. It may be worth noting that there a greater proportion of businesses without a business plan in a revenue bracket less than $3,000,000 annually. 86.7% of those without a business plan fall under this bracket, while only 67.5% of those with a business plan do. Looking beyond this, the proportions even out by the mark of $9 million in revenue, which may suggest that having a business plan has a marginal effect on low-revenue businesses, but near no effect on those with larger revenues.
3. Management by gender:
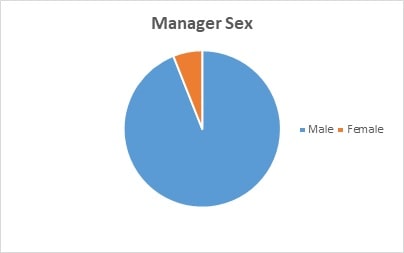
- Just as the majority of management positions have been held by men historically, so too is it the case in the Bendigo region. Of the businesses surveyed, 94% are managed by males and 6% by females.
- Before addressing the salary data of the managers surveyed, I should note that with only 9 female managers included in the survey results, the analysis I provide relating to females may not be a fair representation of the Bendigo region more broadly.
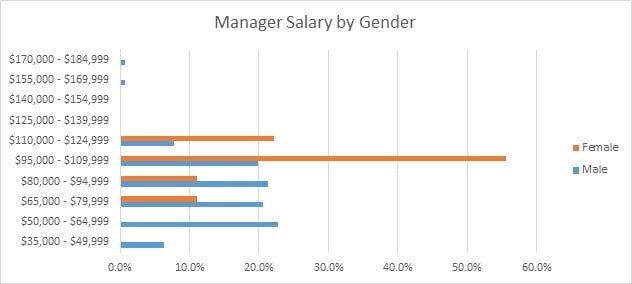
The salaries of both male and female managers are distributed fairly evenly. The average male manager earns $80,850 annually, while female managers earn $101,210 on average. The salaries of female managers are more consistent than their male counterparts. Female salaries range between $78,500 and $119,700 and males range between $36,400 and $183,300. While there are no unusual results to report among female salaries, there were 2 male managers whose salaries exceeded what would be considered normal with salaries in excess of $150,000.
4. Influence of having a business plan on prospects for future investment:
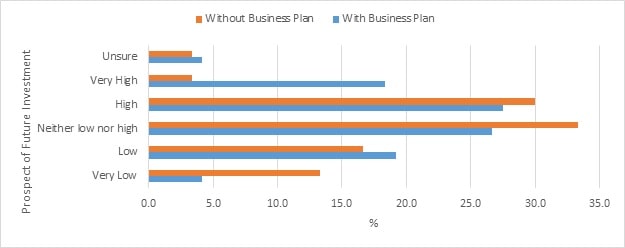
The proportion of companies with and without a business plan reporting beliefs in the prospect for future investment in the middle range (i.e. low, neither low nor high, and high) are nearly identical. However, there are some significant differences at both the lower and upper end of the scale. Only 4.2% of companies with a business plan responded ‘very low’ and 18.3% responded ‘very high’. Among companies without a business plan, these figures were 13.3% and 3.3% respectively. These results confirm a positive relationship between having a business plan and great belief in the prospect for future investment.
5. Relationship between selected variables and gross revenue:
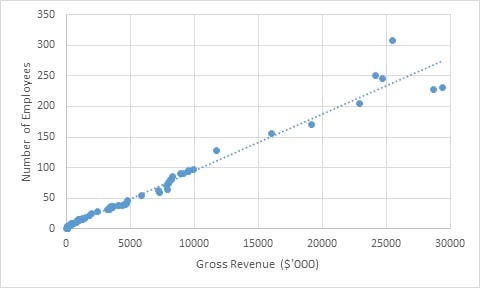
- There appears to be a strong positive relationship between the number of employees in an organisation and gross revenue, with a greater number of employees appearing to increase gross revenue.
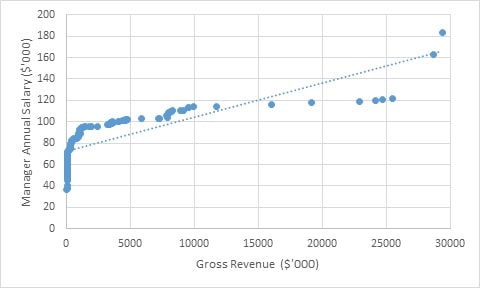
- There appears to be a positive non-linear relationship between a manager’s average annual salary and gross revenue. Salaries under $100,000 have no significant influence on revenue, however it has a small but increasing impact as salaries grow beyond this level.
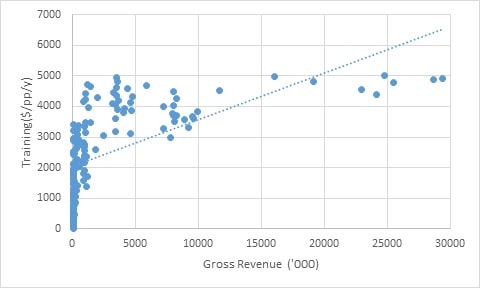
- There appears to be a positive non-linear relationship between training per person per annum and gross revenue. Training spends below $3,000 per person are all attributed to companies with a gross revenue under $2 million. Although training spends above $3,000 per person can also be attributed to businesses with revenue below $2 million, there is an increasing tendency towards greater revenue as training spend increases beyond this level.
I hope these conclusions are to your satisfaction. Please do not hesitate to contact me should you have any questions regarding this analysis or should you require any further assistance with respect of further data analysis.
Regards,
Ashley Black
Business Intelligence (BI)
Question 1
|
Gross Revenue ($'000) | |
|
Mean |
2991.24 |
|
Standard Error |
468.33 |
|
Median |
439.68 |
|
Mode |
78.50 |
|
Standard Deviation |
5735.84 |
|
Sample Variance |
32899916.88 |
|
Kurtosis |
9.11 |
|
Skewness |
2.96 |
|
Range |
29347.14 |
|
Minimum |
48.30 |
|
Maximum |
29395.44 |
|
Sum |
448686.71 |
|
Count |
150.00 |
|
Q1 |
101.07 |
|
Q3 |
3503.39 |
|
IQR |
3402.32 |
|
Tukey's Lower Fence |
-5002.41 |
|
Tukey's Upper Fence |
8606.86 |
|
Empirical Lower Fence |
14216.29 |
|
Empirical Upper Fence |
20198.78 |
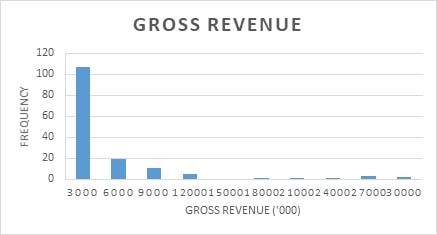
|
Bin |
Frequency |
|
3000 |
107 |
|
6000 |
19 |
|
9000 |
11 |
|
12000 |
5 |
|
15000 |
0 |
|
18000 |
1 |
|
21000 |
1 |
|
24000 |
1 |
|
27000 |
3 |
|
30000 |
2 |
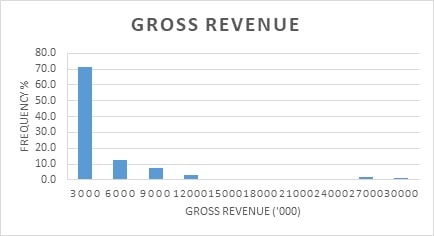
|
Bin |
Frequency % |
|
3000 |
71.3 |
|
6000 |
12.7 |
|
9000 |
7.3 |
|
12000 |
3.3 |
|
15000 |
0.0 |
|
18000 |
0.7 |
|
21000 |
0.7 |
|
24000 |
0.7 |
|
27000 |
2.0 |
|
30000 |
1.3 |
Question 2
|
Gross Revenue ($'000) with Business Plan | |
|
Mean |
3299.50 |
|
Standard Error |
537.59 |
|
Median |
910.84 |
|
Mode |
N/A |
|
Standard Deviation |
5888.98 |
|
Sample Variance |
34680087.16 |
|
Kurtosis |
8.25 |
|
Skewness |
2.81 |
|
Range |
29347.14 |
|
Minimum |
48.30 |
|
Maximum |
29395.44 |
|
Sum |
395940.53 |
|
Count |
120.00 |
|
Q1 |
111.53 |
|
Q3 |
3625.45 |
|
IQR |
3513.92 |
|
Tukey's Lower Fence |
-5159.36 |
|
Tukey's Upper Fence |
8896.32 |
|
Empirical Lower Fence |
-14367.44 |
|
Empirical Upper Fence |
20966.45 |
|
Gross Revenue ($'000) without Business Plan | |
|
Mean |
1758.21 |
|
Standard Error |
908.54 |
|
Median |
112.36 |
|
Mode |
78.50 |
|
Standard Deviation |
4976.30 |
|
Sample Variance |
24763545.70 |
|
Kurtosis |
18.85 |
|
Skewness |
4.16 |
|
Range |
25413.39 |
|
Minimum |
56.83 |
|
Maximum |
25470.22 |
|
Sum |
52746.18 |
|
Count |
30.00 |
|
Q1 |
86.56 |
|
Q3 |
713.19 |
|
IQR |
626.63 |
|
Tukey's Lower Fence |
-853.39 |
|
Tukey's Upper Fence |
1653.14 |
|
Empirical Lower Fence |
-13170.69 |
|
Empirical Upper Fence |
16687.10 |
|
With a Business Plan |
Without a Business Plan | |||
|
Gross Revenue (‘000) |
Frequency |
Percentage |
Frequency |
Percentage |
|
$0 - $3,000 |
81 |
67.5 |
26 |
86.7 |
|
$3,001 - $6,000 |
18 |
15.0 |
1 |
3.3 |
|
$6,001 - $9,000 |
10 |
8.3 |
1 |
3.3 |
|
$9,001 - $12,000 |
4 |
3.3 |
1 |
3.3 |
|
$12,001 - $15,000 |
0 |
0.0 |
0 |
0.0 |
|
$15,001 - $18,000 |
1 |
0.8 |
0 |
0.0 |
|
$18,001 - $21,000 |
1 |
0.8 |
0 |
0.0 |
|
$21,001 - $24,000 |
1 |
0.8 |
0 |
0.0 |
|
$24,001 - $27,000 |
2 |
1.7 |
1 |
3.3 |
|
$27,001 - $30,000 |
2 |
1.7 |
0 |
0.0 |
|
Total |
120 |
100.0 |
30 |
100.0 |
Question 3
|
Gender |
Frequency |
Percentage |
|
Male |
141 |
94.0 |
|
Female |
9 |
6.0 |
|
150 |
100.0 |
|
Male Manager Salary ('000) | |
|
Mean |
80.85 |
|
Standard Error |
1.96 |
|
Median |
80.40 |
|
Mode |
56.60 |
|
Standard Deviation |
23.22 |
|
Sample Variance |
539.11 |
|
Kurtosis |
2.21 |
|
Skewness |
0.85 |
|
Range |
146.90 |
|
Minimum |
36.40 |
|
Maximum |
183.30 |
|
Sum |
11400.20 |
|
Count |
141.00 |
|
Q1 |
62.60 |
|
Q3 |
97.30 |
|
IQR |
34.70 |
|
Tukey's Lower Fence |
10.55 |
|
Tukey's Upper Fence |
149.35 |
|
Empirical Lower Fence |
11.20 |
|
Empirical Upper Fence |
150.51 |
|
Female Manager Salary ('000) | ||||
|
Mean |
101.21 | |||
|
Standard Error |
4.08 | |||
|
Median |
103.10 | |||
|
Mode |
N/A | |||
|
Standard Deviation |
12.23 | |||
|
Sample Variance |
149.45 | |||
|
Kurtosis |
0.53 | |||
|
Skewness |
-0.58 | |||
|
Range |
41.20 | |||
|
Minimum |
78.50 | |||
|
Maximum |
119.70 | |||
|
Sum |
910.90 | |||
|
Count |
9.00 | |||
|
Q1 |
98.70 | |||
|
Q3 |
108.90 | |||
|
IQR |
10.20 | |||
|
Tukey's Lower Fence |
83.40 | |||
|
Tukey's Upper Fence |
124.20 | |||
|
Empirical Lower Fence |
64.54 | |||
|
Empirical Upper Fence |
137.89 | |||
|
Male Managers |
Female Managers | |||
|
Gross Salary |
Frequency |
Percentage |
Frequency |
Percentage |
|
$35,000 - $49,999 |
9 |
6.4 |
0 |
0.0 |
|
$50,000 - $64,999 |
32 |
22.7 |
0 |
0.0 |
|
$65,000 - $79,999 |
29 |
20.6 |
1 |
11.1 |
|
$80,000 - $94,999 |
30 |
21.3 |
1 |
11.1 |
|
$95,000 - $109,999 |
28 |
19.9 |
5 |
55.6 |
|
$110,000 - $124,999 |
11 |
7.8 |
2 |
22.2 |
|
$125,000 - $139,999 |
0 |
0.0 |
0 |
0.0 |
|
$140,000 - $154,999 |
0 |
0.0 |
0 |
0.0 |
|
$155,000 - $169,999 |
1 |
0.7 |
0 |
0.0 |
|
$170,000 - $184,999 |
1 |
0.7 |
0 |
0.0 |
|
Total |
141 |
100.0 |
9 |
100.0 |
Question 4
|
With Business Plan |
Without Business Plan | |||
|
Prospect of Investment |
Frequency |
Percentage |
Frequency |
Percentage |
|
Very Low |
5 |
4.2 |
4 |
13.3 |
|
Low |
23 |
19.2 |
5 |
16.7 |
|
Neither low nor high |
32 |
26.7 |
10 |
33.3 |
|
High |
33 |
27.5 |
9 |
30.0 |
|
Very High |
22 |
18.3 |
1 |
3.3 |
|
Unsure |
5 |
4.2 |
1 |
3.3 |
|
Total |
120 |
100.0 |
30 |
100.0 |
|
Prospect of Investment | |||||||
|
Very Low |
Low |
Neither low nor high |
High |
Very High |
Unsure |
Total | |
|
With Business Plan |
5 |
23 |
32 |
33 |
22 |
5 |
120 |
|
Without Business Plan |
4 |
5 |
10 |
9 |
1 |
1 |
30 |
|
Total |
9 |
28 |
42 |
42 |
23 |
6 |
150 |
|
Prospect of Investment % | |||||||
|
Very Low |
Low |
Neither low nor high |
High |
Very High |
Unsure |
Total | |
|
With Business Plan |
4.2 |
19.2 |
26.7 |
27.5 |
18.3 |
4.2 |
100.0 |
|
Without Business Plan |
13.3 |
16.7 |
33.3 |
30.0 |
3.3 |
3.3 |
100.0 |
|
Total |
6.0 |
18.7 |
28.0 |
28.0 |
15.3 |
4.0 |
100.0 |
|
Prospect of Investment % | |||||||
|
Very Low |
Low |
Neither low nor high |
High |
Very High |
Unsure |
Total | |
|
With Business Plan |
55.6 |
82.1 |
76.2 |
78.6 |
95.7 |
83.3 |
80.0 |
|
Without Business Plan |
44.4 |
17.9 |
23.8 |
21.4 |
4.3 |
16.7 |
20.0 |
|
Total |
100.0 |
100.0 |
100.0 |
100.0 |
100.0 |
100.0 |
100.0 |
Question 5
R^2=0.99
R^2=0.78
R^2=0.60
Buy Analysis of Marketplace Confidence Assignment Answers Online
Talk to our expert to get the help with Analysis of Marketplace Confidence to complete your assessment on time and boost your grades now
The main aim/motive of the management assignment help services is to get connect with a greater number of students, and effectively help, and support them in getting completing their assignments the students also get find this a wonderful opportunity where they could effectively learn more about their topics, as the experts also have the best team members with them in which all the members effectively support each other to get complete their diploma assignments. They complete the assessments of the students in an appropriate manner and deliver them back to the students before the due date of the assignment so that the students could timely submit this, and can score higher marks. The experts of the assignment help services at urgenthomework.com are so much skilled, capable, talented, and experienced in their field of programming homework help writing assignments, so, for this, they can effectively write the best economics assignment help services.
Get Online Support for Analysis of Marketplace Confidence Assignment Help Online
Resources
- 24 x 7 Availability.
- Trained and Certified Experts.
- Deadline Guaranteed.
- Plagiarism Free.
- Privacy Guaranteed.
- Free download.
- Online help for all project.
- Homework Help Services
Testimonials
Urgenthomework helped me with finance homework problems and taught math portion of my course as well. Initially, I used a tutor that taught me math course I felt that as if I was not getting the help I needed. With the help of Urgenthomework, I got precisely where I was weak: Sheryl. Read More

