Plot the time series data and comment on the pattern
Question 1. (20 points) The OFLT Trucking Company needs to determine whether they would increase their fleet size or not. Since their ultimate objective is to satisfy the certain percentage of nationwide transportation demand, they obtained the following data representing total transportation demand in billions of dollars. (You can copy tables into Excel)
Table 1. Demand for transportation
|
Year |
Total transportation demand |
|
1980 |
332.6 |
|
1985 |
486.4 |
|
1990 |
598.3 |
|
1991 |
595.8 |
|
1992 |
638.0 |
|
1993 |
682.7 |
|
1994 |
742.0 |
|
1995 |
772.1 |
|
1996 |
828.1 |
|
1997 |
896.4 |
|
1998 |
931.1 |
|
1999 |
1,009.4 |
|
2000 |
1,059.9 |
|
2001 |
1,052.6 |
|
2002 |
1,075.4 |
|
2003 |
1,097.3 |
|
2004 |
1,160.5 |
|
2005 |
1,248.2 |
|
2006 |
1,312.4 |
|
2007 |
1,391.1 |
|
2008 |
1,359.7 |
|
2009 |
1,175.6 |
|
2010 |
1,320.2 |
|
2011 |
1,467.1 |
|
2012 |
1,560.5 |
|
2013 |
1,608.0 |
|
2014 |
1,661.1 |
|
2015 |
1,630.6 |
|
2016 |
1690.5 |
Source: U.S. Department of Commerce, Bureau of Economic Analysis
- Plot the time series data and comment on the pattern you observe.
- Use weighted moving average method to forecast the demand for 2017.
- Use exponential smoothing with optimal α to forecast the demand for 2017.
- Use regression method to forecast the demand for 2017-2020.
- Compute the following measures of forecast accuracy: mean absolute error, mean squared error, mean absolute percentage error for your forecasts in parts b, c and d.
- Determine the most accurate forecast method and estimate the demand for 2017.
Question 2. (20 points)

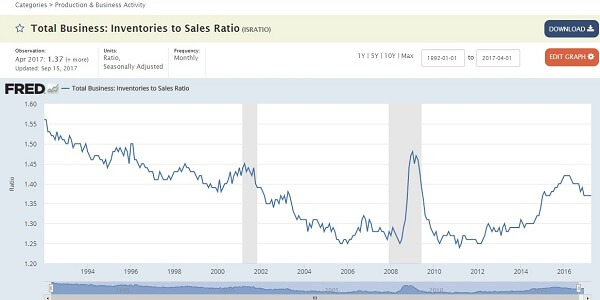
Figure 1. 1992-2017 U.S. Inventory/Sales Ratio
One of the important metric for retailing industry is the inventory to sales ratio. The U.S. inventory/sales ratio data has been collected by US Census Bureau and the data between 1992-present is presented in Figure 1. The full dataset is available in mrtsinv92-present.xlsx . As an entrepreneur with business analytics skills, you are supposed to analyze the data in this file and decide which retail sector (NAICS code) to invest in and the best time to open your stores.
Prepare a report that summarizes your findings, forecasts, and recommendations based on your answers to the following questions:
- Construct a time series plot for adjusted monthly retail inventories of all NAICS codes (441, 442,443, 444, 445,448,452,4521) between 1992-2017. What type of pattern exists in the data?
- Choose three NAICS codes and forecast the monthly retail inventories for the next 15 months using a dummy variable (multiple regression) approach.
- Based on your forecast, decide which of the three businesses you would invest in.


