MSA 516 IDEA Assignment 1
IT Audit: Supporting the Audit Team with Audit Analytics
Case Scenario
You are an IT Auditor as part of the Audit Team. As an IT auditor, your role is to:
- Support the entity-level risk assessment and the audit planning process regarding IT risks and controls
- Document and understand the client processes and controls
- Identify the key controls within a client’s business, especially in relation to IT controls
- Assess the design and effectiveness of IT general controls and application controls
- Support the substantive testing phase of the audit by:
– Using audit tools to confirm the accuracy of financial statements
– Use Computer Assisted Audit Techniques (CAATs) to provide audit assurance by testing entire populations or large portions of the population
Your Senior (Jacob O’Gara) has given you two Excel files from the client (Beach Vacations):
1) copy of the trial balance (tb.xlsx)
2) copy of the general ledger entries (gl.xlsx)
Generalized Audit Software (GAS) packages enable auditors to review computer files as part of the audit process. Two popular GAS packages are ACL (Audit Computer Language) and Caseware IDEA (Interactive Data Extraction and Analysis).
Jacob has requested that you perform Completeness Testing and Journal Entry Testing for the audit team using IDEA. This analysis is due on ________ at midnight.
Assignment Overview
- Step 1: Examine the customer files
- Step 2: Prepare the customer files for analysis
- Step 3: Perform Completeness Testing with CaseWare Idea software
- Step 4: Perform Journal Entry Testing with CaseWare Idea software
- Step 5: Document your findings to your senior in a memo
Submit the following files to Canvas:
- Answer Sheet (Word document)
- Completeness Testing.xlsx (Step 3.9)
- Screenshots for Data 1 for Journal Entry Testing (Queries 1-7) – Word Document
- Memo (Word document)
Step 1: Examining the customer files
1.1: Open the file: tb.xlsx
- Provide a definition of a “trial balance”: _______________________________________
- How many different accounts does this client have? _________________
- What is the account description for account # “0201.0000”? __________
- What is the ending balance for 2017 for account # “0201.0000”? _______
1.2: Open the file: gl.xlsx
- Provide a definition of a “general ledger”: _____________
- What type of account (Balance Sheet or Income Statement) is Prepaid Insurance?
- What is the account code for “RENTAL ROOM REVENUE”? __________
- What type of account (Balance Sheet or Income Statement) is “RENTAL ROOM REVENUE?” _______________
General ledger accounts are often assigned unique identifying account numbers. These numbers may range from a simple three-digit code to a more complex version that identifies individual departments and subsidiaries.
- For this client, accounts with a starting number from 0 to 2 are ________________ accounts (Select one: Balance Sheet or Income Statement).
- For this client, accounts with a starting number 3 or higher are ______________ accounts
(Select one: Balance Sheet or Income Statement).
- Sort the general ledger by batch number. For batch number 25715, what is the sum of the debits associated with batch number 25715? What is the sum of the credits?
Step 2: Prepare the Customer Files for Analysis with Idea
- How many entries are in the general ledger file (GL.xlsx)? ____________________
The Education version of IDEA has a limitation of 5000 records per database (table). For analysis of this case, we must split the GL file into 4 separate data sheets, each of which contain less than 5000 records per sheet.
- In Excel, sort the GL file (Sheet 1) by “Account”
- Create 4 separate worksheets in the Excel Workbook (Data 1, Data 2, Data 3, Data 4)
- Split the GL file in Sheet 1 into 4 different sheets as described below.
|
Account Range | |||
|
Number of Rows |
Start |
End | |
|
Data 1 |
4922 |
0003.0000 |
0170.0000 |
|
Data 2 |
4411 |
0200.0000 |
1120.0000 |
|
Data 3 |
4521 |
1130.0000 |
4905.9240 |
|
Data 4 |
3807 |
5000.9240 |
9400.9299 |
|
Total |
17661 | ||
Step 3: Perform Completeness Testing
3.1: We will import the general ledger from the Excel format into IDEA.
- Open IDEA 10
- Click “Create” on the home tab and create a managed project titled “Completeness Testing”
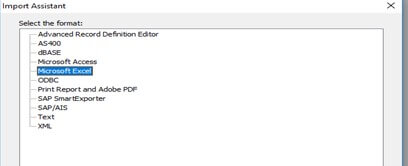
- From the home tab click the desktop button, Select Microsoft Excel from the list, and then choose the GL file from its saved location
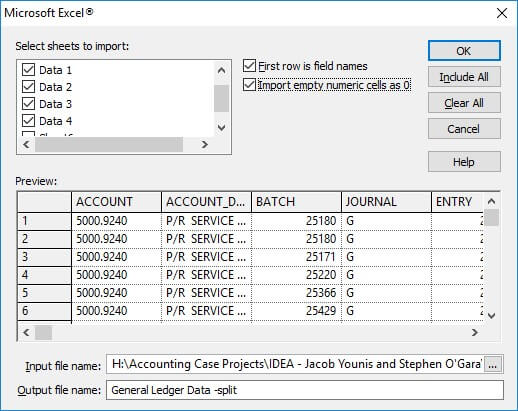
- Select the sheets to import (Data 1, Data 2, Data 3, and Data 4); select the boxes labelled “First row is field names” and “Import empty numeric cells as 0” then click ok
3.2: We will next create a new file in the project. The general ledger provided by the client lists every transaction for the audit period. We now want to create a file that summarizes all journal entries by the account they were posted to. The resulting file will have a list of all accounts, and the net amount of debits and credits posted to that account for the period.
We need to create a new field in each of the databases called “Amount”. The Amount field is a new field that is calculated as “Debits – Credits”. Accounts with a Debit balance will have a positive value, while accounts with a credit balance will have a negative value.
- Select <Data> <Append> and update the following in the Append Field window:
Field name: AMOUNT
Number of decimals: 2
Parameter: DEBITS-CREDITS
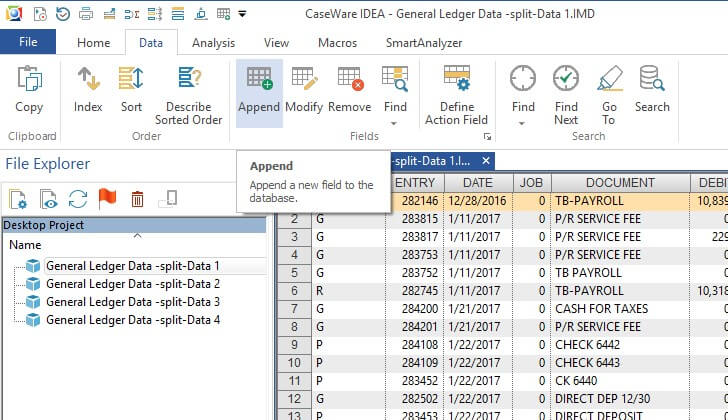
The new field “AMOUNT” has now been added to the Data 1 database.
- Repeat for Data 2, Data 3, and Data 4.
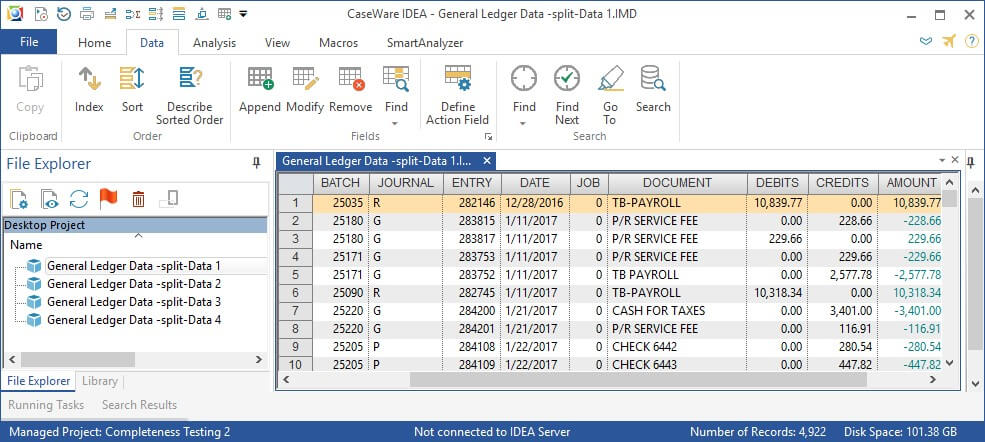
3.3 We now want to create a file that summarizes the amount of all journal entries by the account to which they were posted. The resulting file will have a list of all accounts, and the net amount of debits and credits posted to that account for the period.
For each Data sheet (Data 1, Data 2, Data 3, Data 4)
- Select the appropriate Data sheet (Data 1,Data 2, Data 3, Data 4) to make it the active database
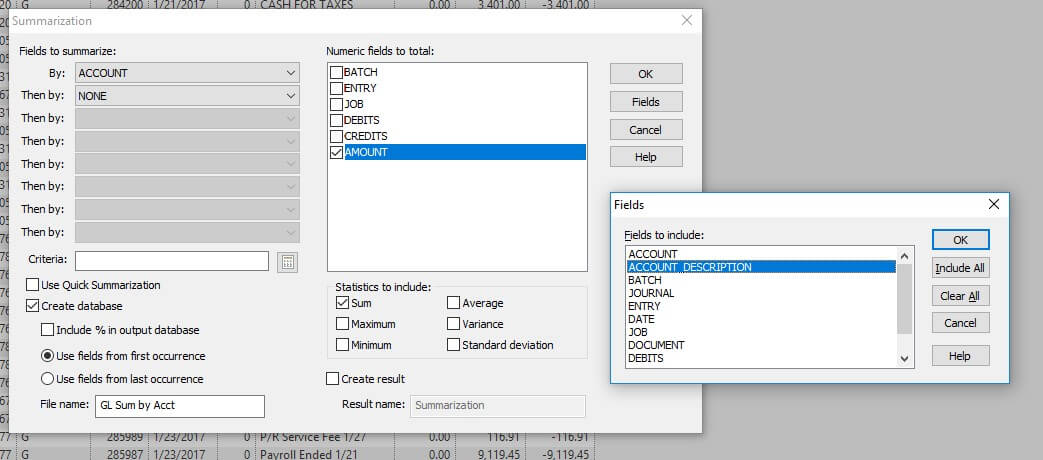
- Select <Analysis> <Summarization>
- Summarize Fields by Account, then under “numeric fields to total” select AMOUNT
- Then click on Fields button and select “ACCOUNT DESCRIPTION”
- Click OK, then change the File name in the bottom left corner to “GL Sum by Acct 1”, then click OK (For Data 2: GL Sum by Acct 2; and so on)
At this point, you will have four “GL SUM BY ACCT” files:
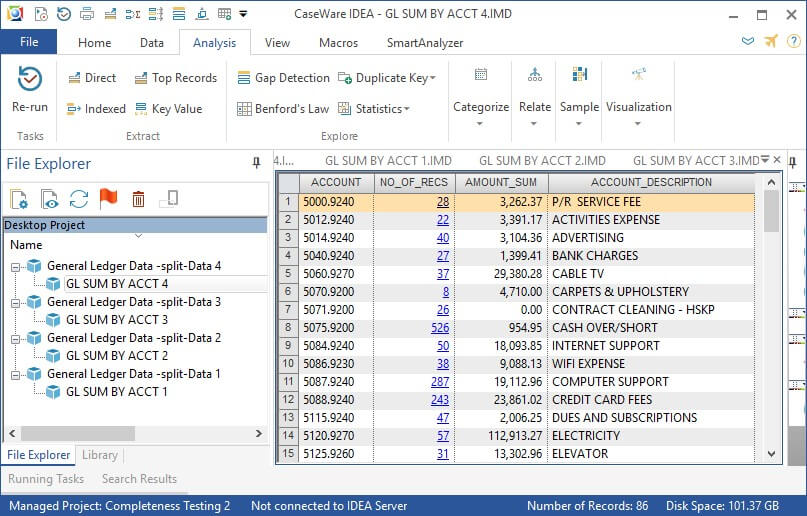
3.4: Next, we need to combine these 4 “GL SUM BY ACCT” files into 1 file.
We do this by selecting the first “GL SUM BY ACCT 1” file, and then appending each of the other files to it.
- Make sure that each of the “GL SUM BY ACCT” databases are open in the right window
- Right click “GL SUM BY ACCT 1” and select “Append with Open Database”
- Filename: “GL SUM BY ACCT ALL”
- Select each of the “GL SUM BY ACCT X”
At this point, “GL SUM BY ACCT ALL” lists each unique account and its total activity for the year.
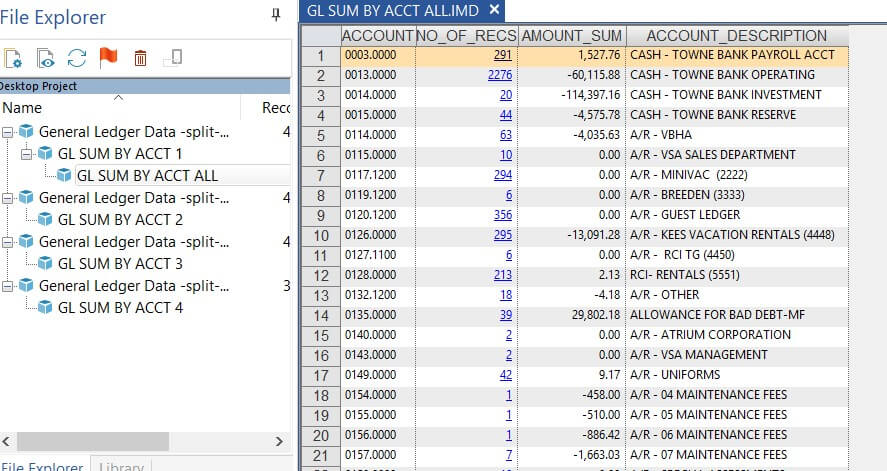
- How many rows are in “GL SUM BY ACCT ALL”? ________________
- Does this match the number of accounts in the trial balance? ______________
3.5: IMPORTING THE TRIAL BALANCE INTO THE PROJECT
The next step in the project is to import the Trial Balance spreadsheet into the project.
- <HOME> <DESKTOP> (IMPORT)
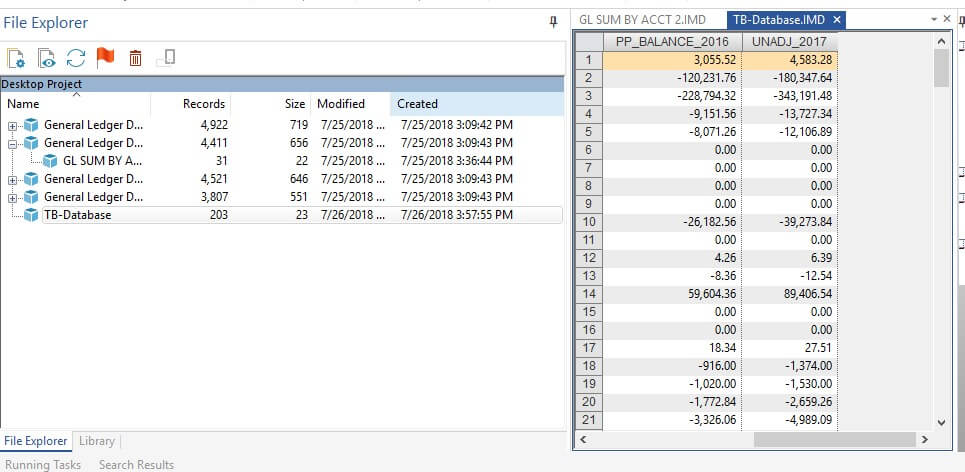
3.6: Joining the trial balance file (TB-Database) and “GL Sum by Acct All” file together
The objective is to combine the prior period final balance for each account (from the TB) with its current year activity (from the GL) to see if it adds up to what the client has entered for their current year final balance (from the TB).
This will result in a list of all accounts with their prior period final balance (from the TB), the current year activity (from GL Sum by Acct), and the current year ending balance (from the TB).
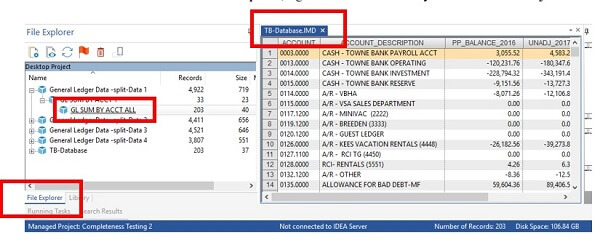
- With the Trial Balance database opened, right click on “GL Sum by Acct All” and click join with open database
- In the popup menu select “All records in both files,” and for the file name type “Completeness Testing”
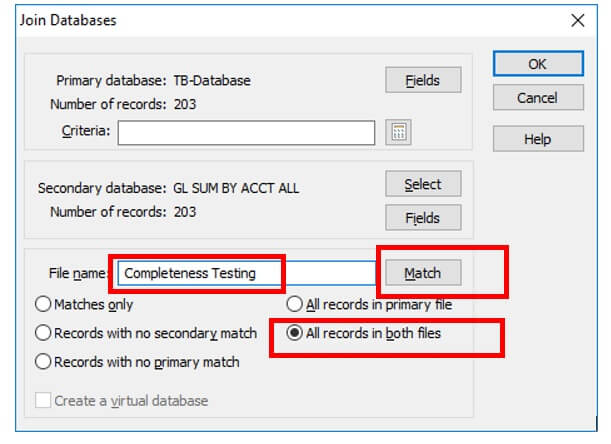
- Still in the popup menu, click Match next to file name and select “ACCOUNT (C)” for both primary and secondary, then click OK

- Now select the “Fields” button in the Secondary Database section. Deselect all fields except for “AMOUNT_SUM”, then click OK.
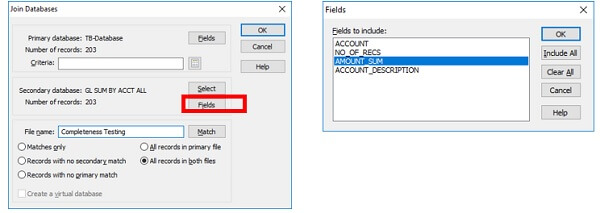
The above step ensures only the “AMOUNT_SUM” field is brought into the completeness testing file since it is the only field we need
A new file is created called “Completeness Testing” and it should look like this:
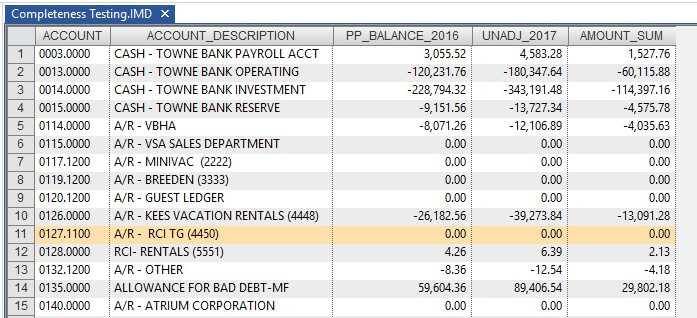
This new file is essentially the same as the trial balance, but with the account activity from “GL Sum by Acct All” pulled in.
3.7 The next steps will use the prior period balance and amount sum to create a calculated field of what the ending 2017 balance should be. This will then be compared to the ending 2017 balance from the trial balance, and any differences will be sent to the audit team.
In order to roll forward the balances, income statement account must be separated from balance sheet accounts. This is because balance sheet accounts carryover every year, while income statement accounts reset at year end.
In this GL, balance sheet accounts have a first digit of between 0 and 2, while income statement accounts start with a 3 or higher. We will now create a calculated field that uses the equation:
If the “ACCOUNT” field starts with a number less than 3
then add “PP_BALANCE_2016” and “AMOUNT_SUM”
else If the “ACCOUNT” field starts with a 3 or higher
then use the “AMOUNT_SUM” field
- With the “Completeness Testing” table open, double-click anywhere on the data to open the field manipulation box.
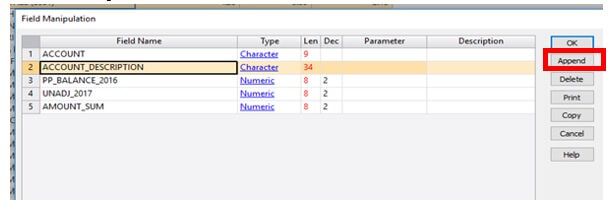
- Click Append then Type “CALC_UNADJ_2017” as the field name. Leave the type as virtual numeric then enter “2” in the “Dec” column
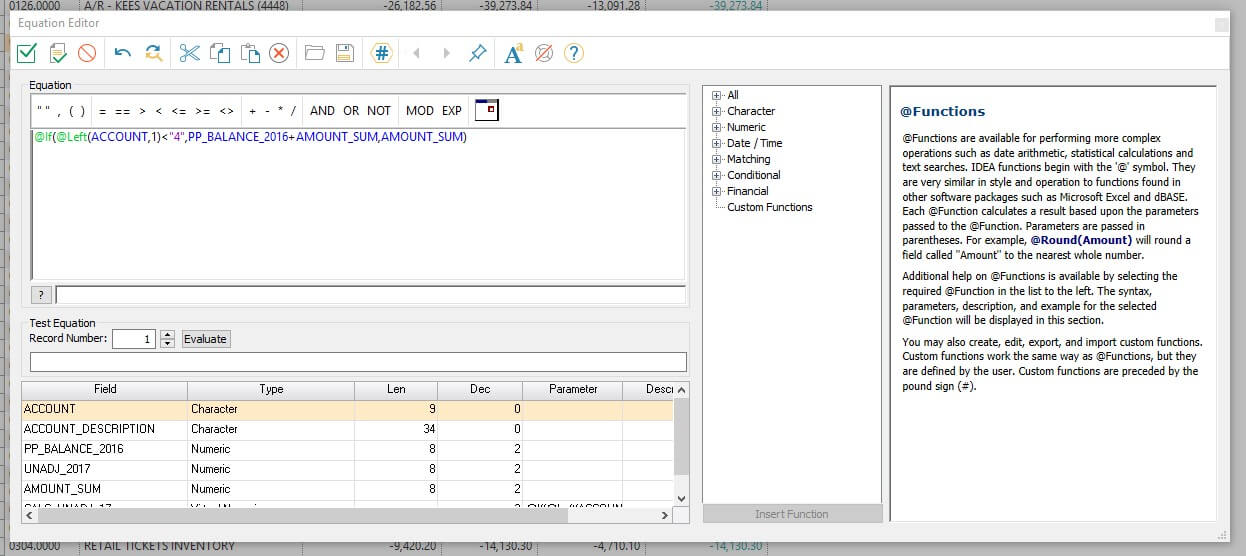
Creating equations in IDEA is similar to Excel, except the @ symbol is used to start an equation rather than the = sign.
- Click in the Parameter field for CALC_UNADJ_2017 and type in the following equation:
@If(@Left(ACCOUNT,1)<"3",PP_BALANCE_2016+AMOUNT_SUM,AMOUNT_SUM)
- What does the “LEFT” function do?
- If Balance Sheet accounts ranged from 0 to 6 and income statement accounts ranged from 7-9, what would be the correct formula to use?
- Click the green checkmark at the top left of the dialogue box and then click OK
3.8: We now have a calculated field that should be compared to the “Unadj_2017” field to check for errors. In order to do that, we will make another column called “DIFF” that calculates the difference between these two columns.
- Double click anywhere on the data to bring up the field manipulation field
- Append a new field titled “Diff”, type is virtual numeric, and enter “2” under Dec for the decimal place
- Click in parameter and type in the following equation:
CALC_UNADJ_2017 - UNADJ_2017

There is now a column named Diff.
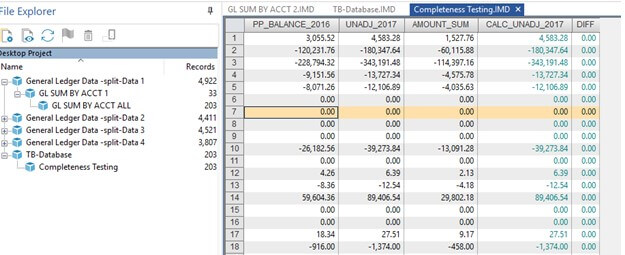
- What is the value of DIFF for every row in the table?
- What does the result from Q17 mean? Does this indicate any problems?
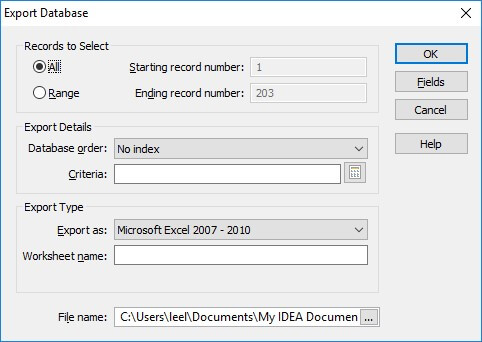
3.9: Export the Completeness Testing table into an Excel worksheet and submit on Canvas.
<HOME> <EXPORT> <Microsoft Excel 2007-2010>
Step 4: Journal Entry Testing
Now that we have finished the Completeness Testing, the next step is Journal Entry Testing.
For this part of the testing, the Audit Team has identified three criteria as risky:
Criteria Description Risk Weighting
- Journal entries posted on a Sunday 4
- Journal entries with amounts ending in 000.00 2
- Journal entries posted to cash account 1
The audit team wants you to pull all entries that meet these criteria and apply risk weightings to them to identify the riskiest journal entries.
Your task is to:
1) pull the individual journal entries which meet the criteria
2) apply the associated risk weighting to them
3) identify the riskiest entries
Before we do this task, we need to review how to filter data in IDEA. The next steps discuss how to filter data. Once we learn how to filter, you will use your knowledge of filtering to identify the risky transactions based on the criteria above.
Filtering Data
To prepare for the Journal Entry Testing, we will work through 6 queries together with the journal entries from the “Data 1” sheet only.
For Data 1, we want to answer the following questions:
Q1: How many journal entries have an AMOUNT >= 5000?
Q2: How many journal entries were posted on a Saturday?
Q3: How many journal entries are greater than 5000.00 AND posted on a Saturday?
Q4: How many journal entries are associated with a CASH account?
Q5: How many journal entries end in “.50”?
Q6: How many journal entries have an AMOUNT >= 5000 AND are associated with a CASH account AND were posted on a Saturday AND end in “.50”?
Question 1
Let’s filter the data so that only the journal entries larger than 5000.00 are listed. Note that we need to take the absolute value of AMOUNT.
Click “Criteria” from the Properties pane
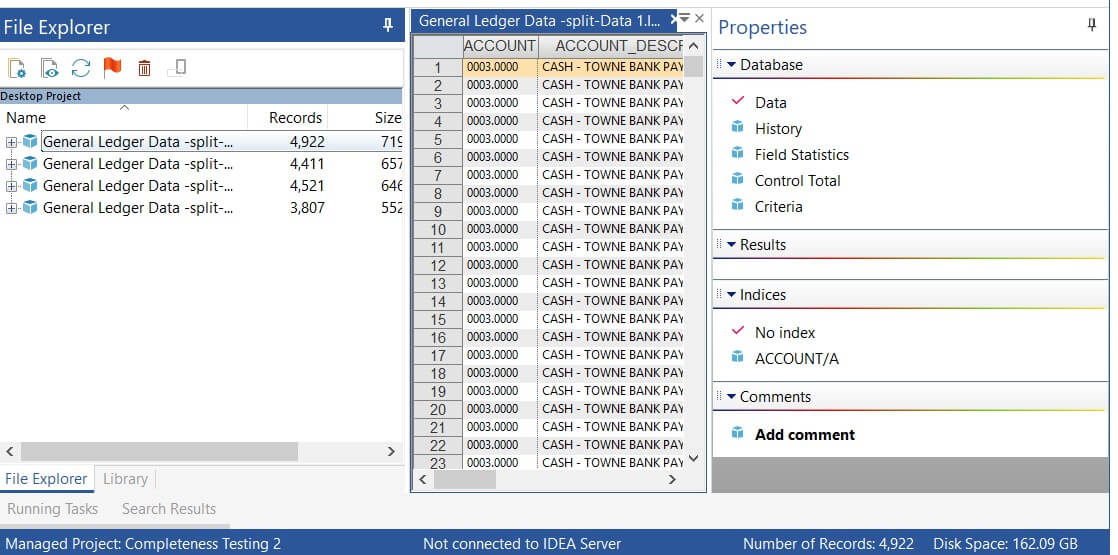
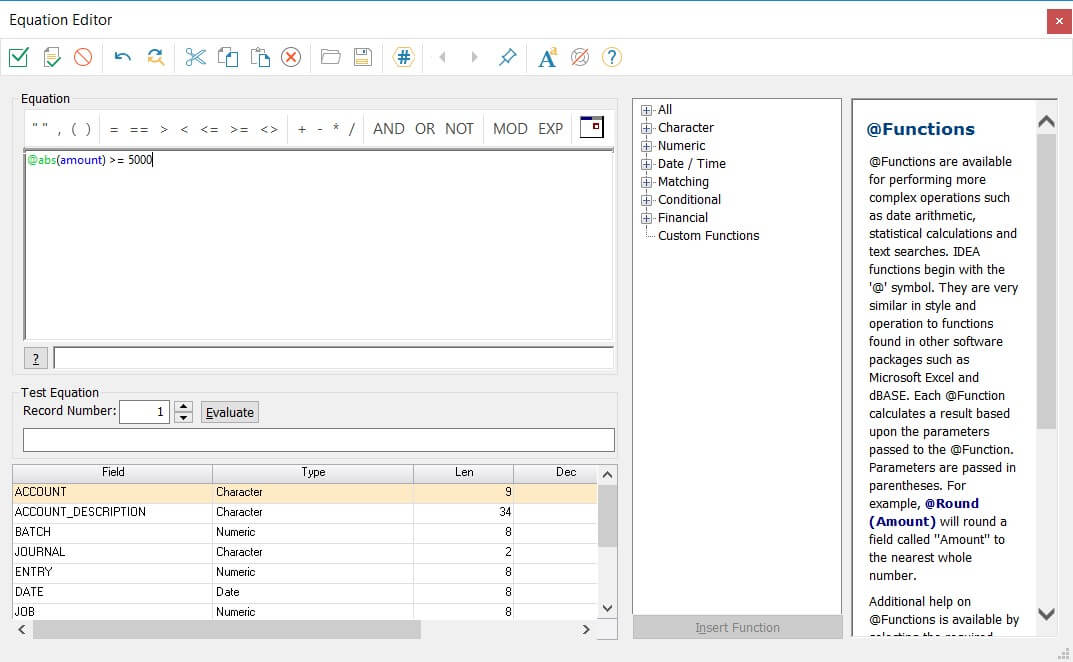
In the criteria box, enter the following:
@abs(amount) >= 5000
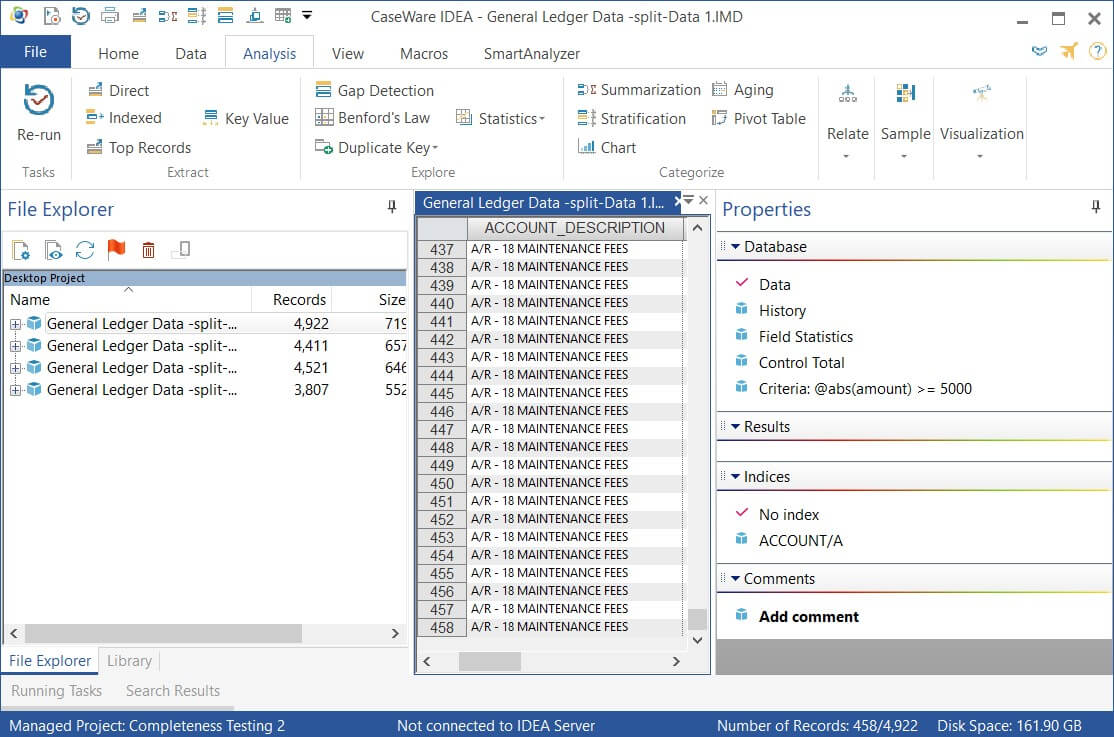
You can save this filtered result as a separate database:
<HOME> <SAVE AS>

After saving the filtered result as a separate database, you can delete this filtered result from the Data 1 display by right-clicking the “Criteria” and selecting “clear.”
- How many records from Data 1 are greater than or equal to 5000?
Question 2
Q2: How many records from Data 1 were posted on a Saturday?
Let’s look at the @Dow function.
@Dow(): Returns the day of the week as a number. For example, 1 for Sunday, 2 for Monday, and so on.
- What is the function for Saturday? @Dow(DATE) = ___
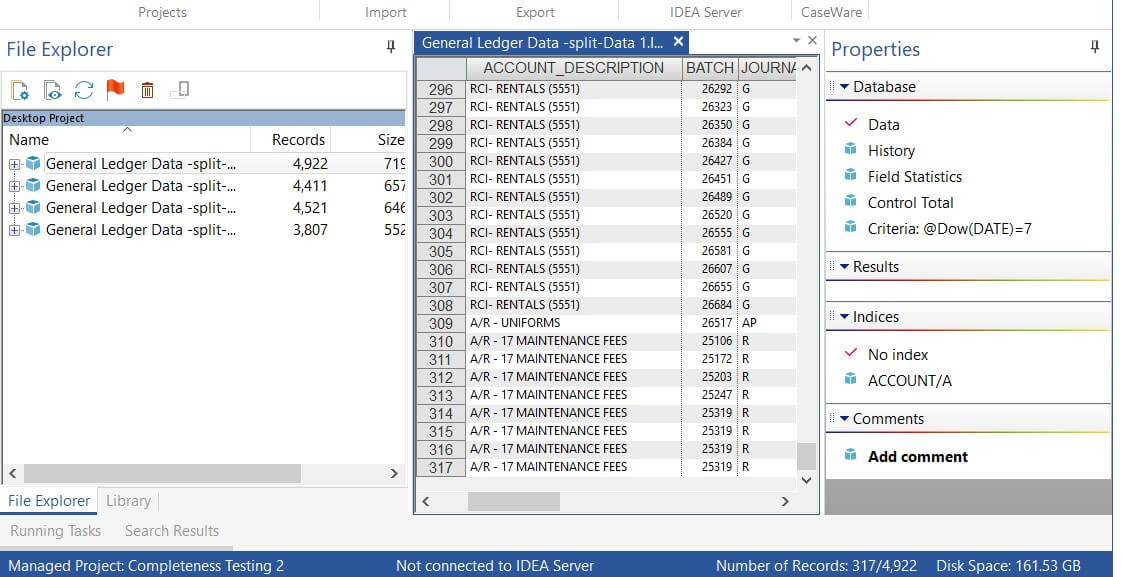
- How many records from Data 1 were posted on a Saturday?
Question 3
Q3: How many records are greater than 5000.00 AND posted on a Saturday?

- How many records are greater than 5000.00 AND posted on a Saturday? ______
Question 4
Q4: How many journal entries in Data 1 are associated with “Cash” in the account description?
@Isini(): This is similar to the @Isin except that it is not case sensitive. It searches for the occurrence of a specified string or piece of text in a Character field, Date field, or string and if found it returns the starting character position of the specified string. If the string is not found, a value of 0 is returned.
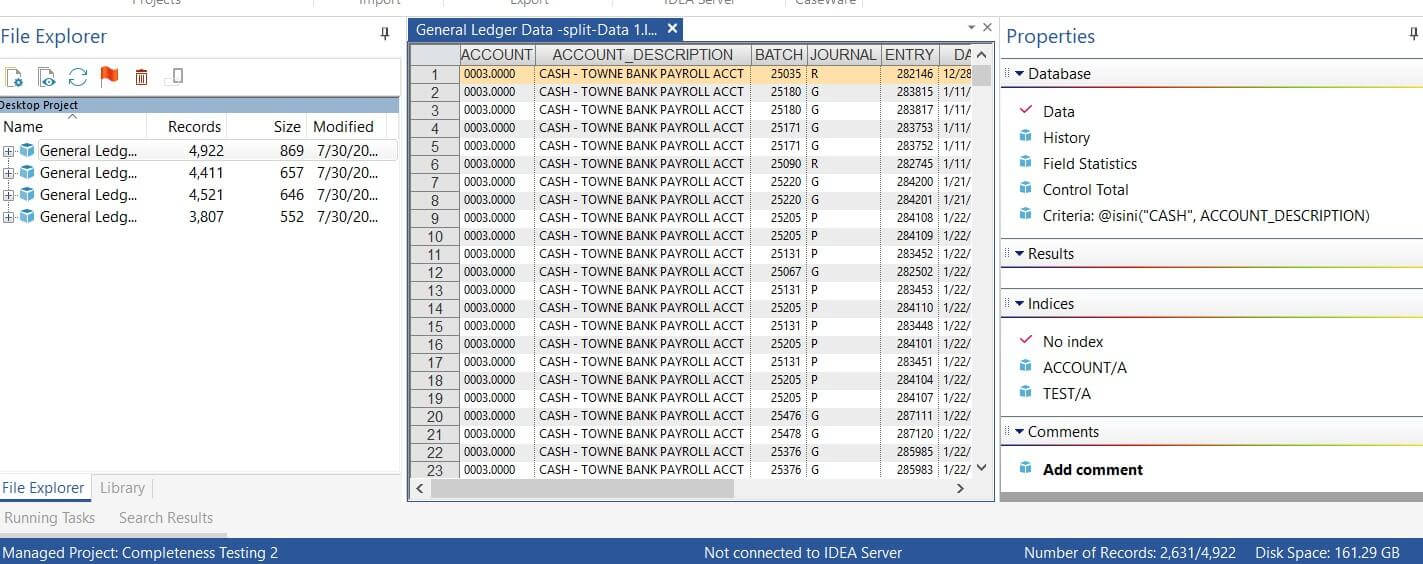
- How many journal entries in Data 1 are associated with “Cash” in the account description?
- What would be the correct syntax for finding all of the rows with “REVENUE” in the Account Description? @ISINI(_____________________)
- How many journal entries are associated with “REVENUE” in the account description in Data 1?
Question 5
Q5: How many journal entries end in “.50”?
We want to examine the journal entries ending in a specific value. For example, journal entries ending in “.00” or “.99” may be deemed as worthy of further scrutiny. To accomplish this, we need to use two functions: @CurForm() and @Right().
@CurForm: @CurForm is used to format a Numeric field, with any specified thousands separator and decimal separator. This @Function returns a Character field and is often used for reformatting a currency field to display results.
@CurForm(AMOUNT, “,”, “.”,15,2) transforms a numeric field into a text (string) field.
The variable must be a text (string) field in order to be used by other string manipulation functions.
@Right: Identifies the specified number of rightmost characters in the character field or string (including trailing spaces).
Example:
@Right(“9999.99”, 4) would return “9.99”
26. What would @Right(“3499.00”, 5 return?
- What would @Right(“19999.99”, 5) return?
Amount is a variable that is in a number format. If we wanted to return all numbers ending in .50, e.g. 19999.50 or 239.50, what formula would we use?
First, we need to convert the Amount into a Text format
@Curform(AMOUNT, “,”,”.”,15,2)
Next, we need to examine the last 3 digits (“.50”)
@Right(@Curform(Amount, “,”,”.”,15,2), 3)
Finally, we need to check if those last 3 digits is equal to “.50”
@Right(@Curform(Amount, “,”,”.”,15,2), 3) == “.50”
This would return all rows with AMOUNT ending in “.50”
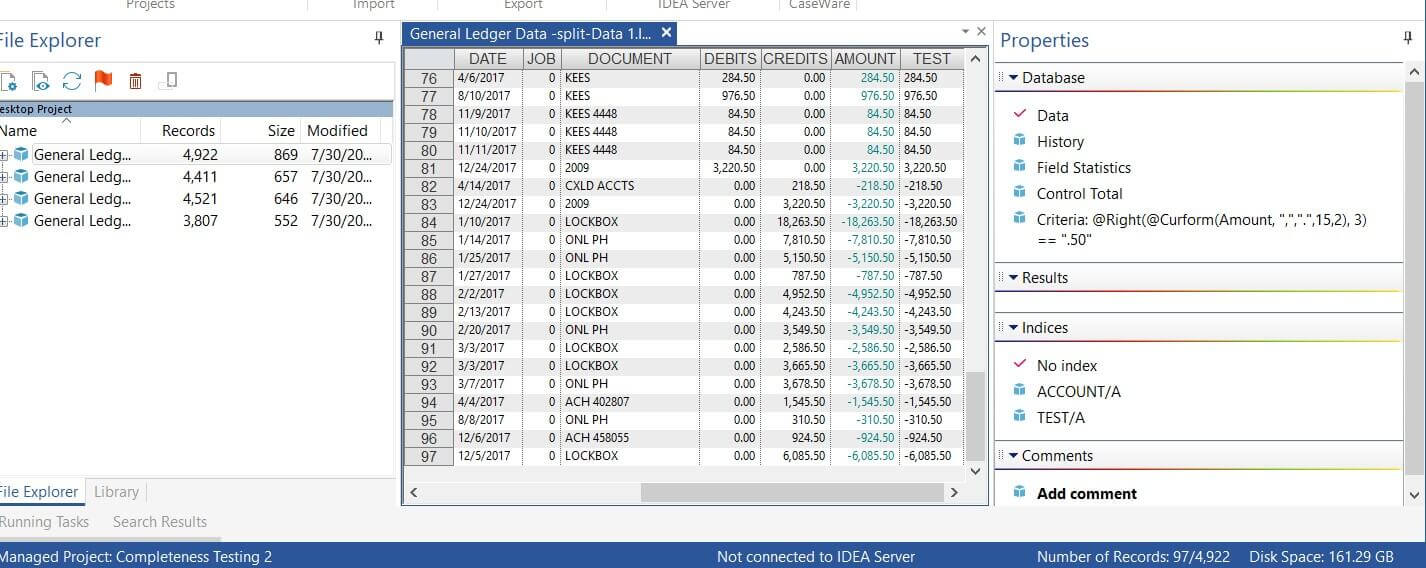
- How many entries end in “.50”? ___________________
- What is the difference between “=” and “==”? Hint: hover over the “==” button in the criteria window.
Question 6
- How many journal entries have an AMOUNT >= 5000 AND are associated with a CASH account AND were posted on a Saturday AND end in “.50”?

- Now that you know how to filter, answer the following queries in IDEA on your own.
Save a screenshot of the results for Data 1 for all of the seven queries (Data 1 only). You do not need to save the screen shots for Data 2, Data 3, and Data 4. Fill in the Table below with your answers (available in the answer sheet.)
|
Data |
Query #1 Number of Entries Posted on Sunday (4 points) |
Query #2 Number of Entries with “000.00” (2 points) |
Query #3 Number of Entries related to “Cash” (1 point) |
|
Data 1 | |||
|
Data 2 | |||
|
Data 3 | |||
|
Data 4 | |||
|
TOTAL |
|
Data |
Query #4 Number of Entries Posted on Sunday AND Cash (5 points) |
Query #5 Number of Entries with “000.00” AND Cash (3 points) |
Query #6 Number of Entries Posted on Sunday AND “000.00” (6 points) |
Query #7 Number of Entries Posted on Sunday AND “000.00” AND “Cash” (7 points) |
|
Data 1 | ||||
|
Data 2 | ||||
|
Data 3 | ||||
|
Data 4 | ||||
|
TOTAL |
Step 5: Document the results in a one-page memo to your Senior, Jacob O’Gara
Memo Guidelines
Include the WHO, WHAT, WHY, WHEN, WHERE, and HOW
One-page (single-spaced; single space between paragraphs; no indention on first paragraph; 11 point font)
|
Memo Segment |
Description | |
|
Heading Segment |
TO: Readers' names and job titles FROM: Your name and job title DATE: Current date SUBJECT: What the memo is about |
WHO, WHAT, WHEN, |
|
Opening Segment / Task Segment |
Brief identification of what you did (i.e. completeness testing and journal entry testing), for which client, and why you did it. |
WHAT, WHO, WHY |
|
Discussion Segment |
· Additional details of Completeness Testing · Additional details of Journal Entry Testing, including the Risk Criteria, a table of the query results, and a table of the entries that require further investigation |
HOW |
|
Summary Segment |
Restatement of the results, location of supporting documentation, and recommendations of next steps |
WHERE |


