Miller Value Part C
PART C – MILLER VALUE
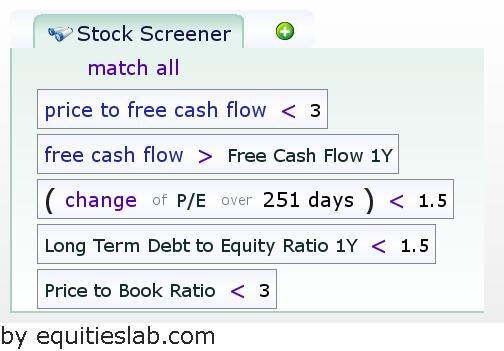
We defined the Miller Value Screen as follows:
1. We set our first criterion based on free cash flow stating that the price to free cash flow should be less than 3, this is because based on Miller Value Investing strategy, he focused more on valuation from the cash flow perspective and a low price to free cash flow has been considered to be indicative of value stocks.
2. We also set another criterion based on free cash flow that the current free cash flow this year has to be greater than the free cash flow the previous year, this is because stocks capable of generating higher cash flow is also indicative of being a value stock.
3. Also, we set a criterion based on the change in the price to earnings ratio over 251 days to be less than 1.5. We had initially set the change over 252 days which is assumed to be the number of trading days in 1 year, however, after adding the restrictions to do the backtest, we arrived with only 20 stocks at the end of the day when using 252 days.
The reason for including this criterion is because stocks with low price to earnings ratios are more often than not regarded as value stocks and since Miller value investing strategy was focused on stocks below their intrinsic value, this is equally important.
4. Finally, we add further criteria based on debt to equity ratio 1 year ago to be less than 1.5 and price to book ratio to be less than 3 just to filter for some more valuation stocks.
5. In the end, after including the restrictions, we end up with 33 stocks in our defined Miller Value Screen from January 1, 2010 – January 1, 2020.
A screenshot of the editor is shown below:

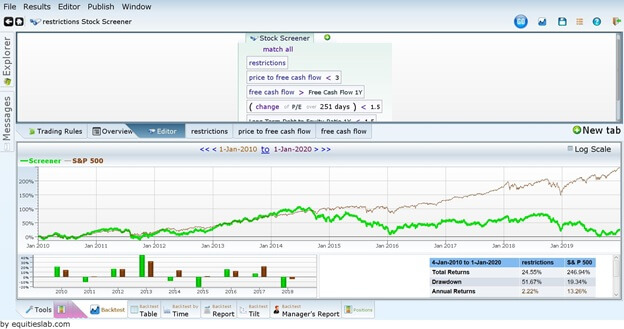
A screenshot of the relative performance graphs against the S&P 500 is shown below:

Based on the results from the backtest analysis, I would choose not to invest according to the Miller value strategy because on average, it generated lower returns when compared with the S&P 500 benchmark.
Although we see from the graph that the Miller value starts right by slowly performing above the S&P 500. Citing our results, from January 2010 – February 2010, our Miller value screener has 3.62% returns when compared to the S&P 500 which earned only 2.59%. We also see from our results, that our Miller Value screener started experiencing a decline in March 2012 – May 2012 generating negative returns more than those generated by the S&P 500. Shortly from August 2012 up until 2015, our Miller Value screen seems to be performing slightly better against the S&P 500 benchmark. However, afterwards, we see that our Miller Value screen performs poorly.
Citing more results, the average annualized monthly returns for the past 10 years using our Miller value screener is 2.88% whereas that of the S&P 500 stands at 13.8%. The standard deviation of our Miller value screener was 6.21% which is greater than that of the S&P 500 which was 3.69%.
We also see that in one of the best months in the period, our Miller value screener generated a return of 16.74% which is greater than the S&P 500 index of 10.91% but then in one of the worst months, the S&P 500% generated a less negative return of -6.38% compared to our Miller screener which was -16.72%. This also corroborates that the Miller value strategy may not be best to invest in.

