Industry and Competitor Analysis
Introduction
This report is created with the purpose to provide information on firm 3 business information. The report will also include the information on the industry analysis carried out for the industry in which firm 3 is working under. There is also competitor analysis carried out to know the position of the firm for period 7 against the competitor. The competitor’sanalysis will be using the last 6 periods to help in the standing of the business.
Description of the Business
The Market-Views, Inc. (firm3)is a product-based companyin the field of Information Technology. It provides a virtual meeting platform (VMP) product to their customer. The purpose of the firm’s virtual meeting platform product is to provide the customer with an online audio and video conferencing platform with the option of best collaboration software. The vision of the firm to provide best option of virtual meeting platform product and digital vocal communicator to their customer. The long-term objectives for the firm are:
- Provide a high-quality Virtual Meeting Platform to the customers
- Improving of the Virtual Meeting Platform with better features, ease of learning and error protection
- Gain new customers while maintaining current customers relationships
- Continuous expanding of the firm’s business
- Growth in the business’s long-term profits
- Increase the market share of the firm
Industry Analysis
Market factors & Industry Structure
The market share between the firm and its three other competitors should be equally
4.1
distributed between the six periods of data gathered. This is reference to the market share based on the channel and generally overall. This can be observed by the table (Table 1) below.
Table 1: Market Share in the Industry
|
Market Share by Cha |
nnel | |
|
Brand |
Channel 1 |
Channel 2 |
|
Firm 1 |
0.25 |
0.25 |
|
Firm 2 |
0.25 |
0.25 |
|
Firm 3 |
0.25 |
0.25 |
|
Firm 4 |
0.25 |
0.25 |
4.2
The industry structure on which the firm’s and its competitors’ position is evaluated is on
4.3
the bases of the market share on two parameters. The two parameters are the unit sales per period and retail sales per period. There is also a look at the channel 1 and channel2 sales, based on units and retail, per period in the industry. It is important to look at this point because it can help in understanding which channel method should be used by the company. Furthermore, in the analysis of the 4.4 firm position in the industry can help in knowing which areas the firm can improve upon for the products being offered. Table 2: Actual Market Share in Industry
|
Brands |
Unit Sales |
Market Share (Unit Sales) |
Difference |
Retail Sales |
Market Share (Retail Sales) |
Difference |
|
Firm 1 |
216004 |
1.457 |
0.149 |
$ 64,989,640.00 |
1.53 |
0.23 |
|
Firm 2 |
211061 |
1.496 |
0.11 |
$ 57,463,881.00 |
1.75 |
0.01 |
|
Firm 3 |
229500 |
1.606 |
0 |
$ 71,272,362.00 |
1.76 |
0.00 |
|
Firm 4 |
198927 |
1.442 |
0.164 |
$ 36,428,887.00 |
1.06 |
0.71 |
Figure 1: Market Share (Units Sales)
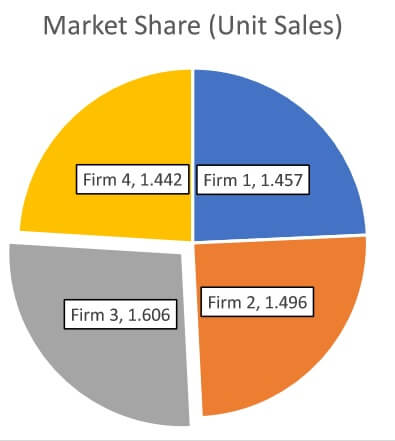
While observing the table and graph above, it seems that the company has an overall greater share in the industry over past 6 periods of data is gathered. Furthermore, the company or firm that is a competition for the Firm 3 in the industry is Firm 2. This is because the difference of the 0.11 for the market share for unit sales which can be observed by the pie chart and the table above.
Figure 2: Unit Sales Per Channels
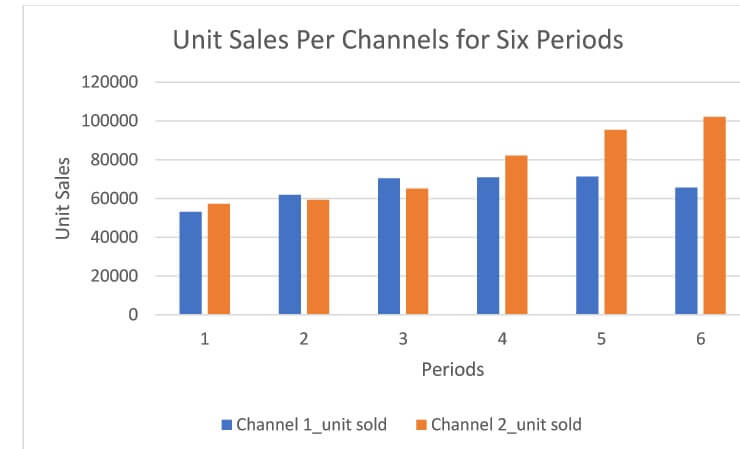
While looking at the units sold of the virtual meeting platform over the six period in the industry, it is indicated that overall units sold is better via channel 2 than channel 1. In fact, in the six periods only twice has there been a better unitsale via channel 1. Thus, it makes sense based on the channel sales in the industry that the firm consider selling their virtual meeting platform via the use of channel 2, i.e. the Discounted Dealers, to the different customer segments.
Figure 3: Retail Sales for Digital Vocal Communicator
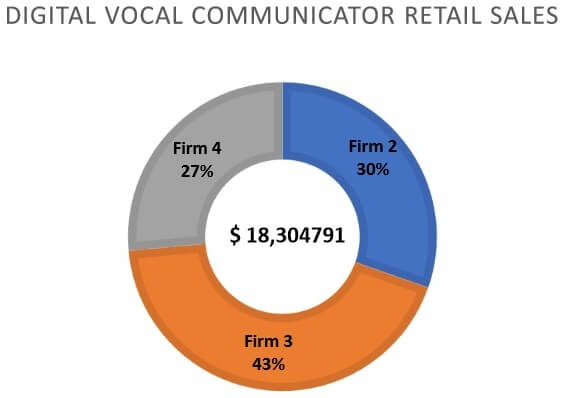
While observing the graph above, it can be observed that the firm 3 add the new product, digital vocal communicator, into their products options based on the industry options. It can noticed that the market share based on retail sales for the product in the industry and market, firm 3 has gained majority of the share and sales, It can be observed by the market share percent, which is about 43%. The firm that can provide some level of competitionfor the product is Firm 2. This is because they firm entered the market with the digital vocal communicator before the firm 3 had entered.
Macro Environment
Before seeing the macro environment for using of the virtual meeting platform, it is required to have some basic understanding of what macro environment is. Macro environment is the external societal factors that can impact on how a firm is working in their respective industries. The macro environments factors are generally outside the control of the firm and has a large scale impact on the point of the industry (Microenvironment vs. Macroenvironment | Retail Management, n.d.). The macro environment analysis can be done by using PESTEL analysis. Conducting a macro environment can help in determining whe7.1 ther the firm will be a success based on the trends in the market and its competition. The macro environment analysis can help provide a strategic marketing plan for the two products in period 7 (Mbithi, Muturi and Rambo, 2017). Given that PESTEL is used for conducting the macro environment analysis, it is important to carry out the analysis using that. PESTEL analysis is the political, economic, social, technological, environmental, and legal factors. The political factor relates to the government of the country and how it can influence the industry. For 7.2 instance, the number of virtual meeting platforms allowed in the country. Economic factor deals with the economy condition of the industry, like the tax amount, trends. This can7.3 influence on the sales of the VMPs. The social factor looks at the social and cultural 7.4 aspect of a country, the society may use or may use the VMPs and help in deciding the features of the VMPs. The technological factor looks the upcoming technologies tha7.5 t can
7.6
help with the product. The environmental factor helps in understanding how the environment can affect or be affected by the product, and finally the legal factor looks at
7.7
the laws and regulation that the company has to follow (Microenvironment vs.
Macroenvironment | Retail Management, n.d.).
7.8
Competitor Analysis
The analysis carried in this section is to understand which of the three competitor firms is the biggest competition for firm 3. It looks the different attributes for both of the products being sold by the firm over the six periods. There is also analysis carried out to the firms and the competitor market share per segment. This will help in knowing which segment for the firm can have the maximum profitable benefits for the company.
Figure 4: Market Share by Channels
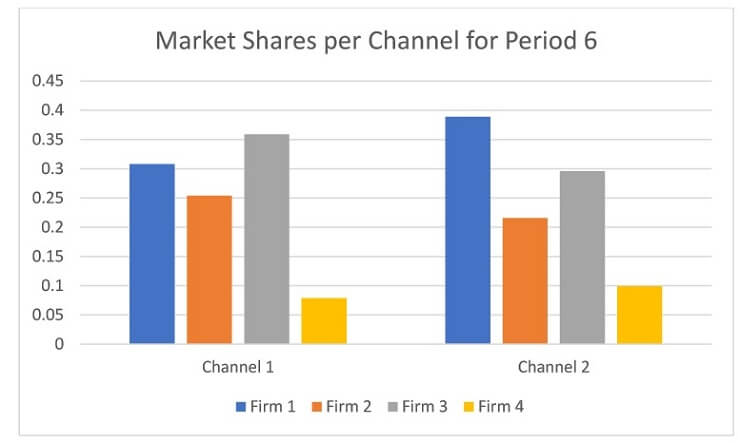
Looking at the graph above, it can be noticed that the maximum market share between the two channels, it seems that firm 3 has a greater share in selling via channel 1 for period 6. While being the secondfirm with the maximum sales and market share via channel 2. Though, it seems that the greatest competition for market share for sales by channels for firm 3 is firm 1. This will cause the firm to take actions that can help in increasing the sales via the two channels.
Figure 5: Digital Vocal Communicator Market Share
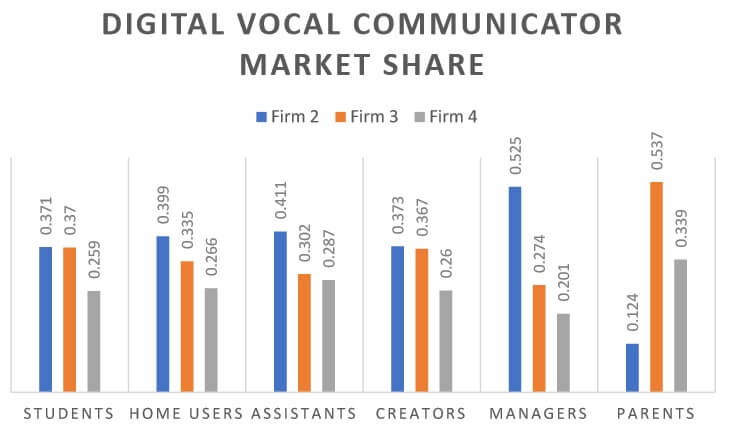
While looking at the graph for the market share for the digital vocal communicator, it seems that the maximum share is gone to firm 2 for most of the customer segments. The customer segment that the firm has the maximum market share for this product is parents (0.537). Thus, the firm should consider focus more of it marketing resources for this product towards the concerned parents’segment. Though, the firm should also be aware of the firm in this segment as it can cause a competition. There are other two segments that the firm can use marketing to take a lead in the competition. These two segments are modern students and creators has there is a lower level of difference between firm 2 and firm 3.
Figure 6: VMP Feature Count
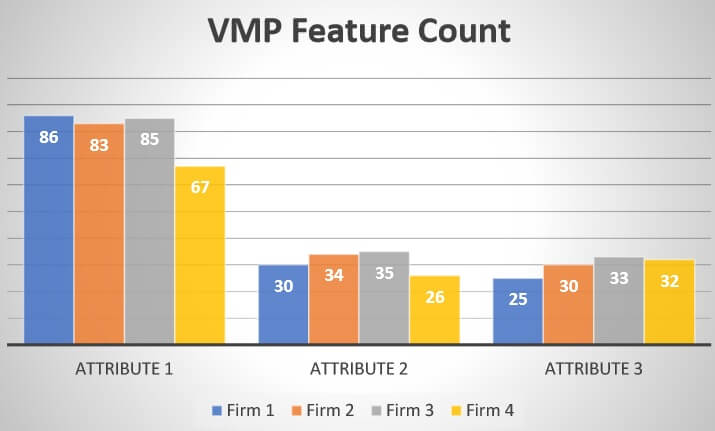
The graph above shows the overall count for each feature or attribute of the virtual meeting platform offered by each of the firm. While observing the graph, it can be noticed that for attribute 2, ease of learning, and attribute 3, error protection, firm 3 is ahead of its competitors. Though, it the difference is not massively different between the firms. Thus, firm 3 will have to make greater improvement tocontinue with the lead for these two attributes. While looking at attribute 1, special features, the firm is in second position with an overall difference of 1 feature. The lead firm for attribute 1 is firm 1 with 86 special features. Thus, to beat firm 1in special feature, the firm might have to consider making some changes in virtual meeting platform product by at least 2 new features. If 2 new special features are added,then there will be no cost for the change. While increasing the feasibility range of attribute 2 and 3 will cost a bit. This depends on the total range being considered. For instance,if 1 change is considered for both the cost will be $5,000 and $3,000 for attribute 2 and attribute 3 respectively.
Figure 7: Average Market Share for VMP
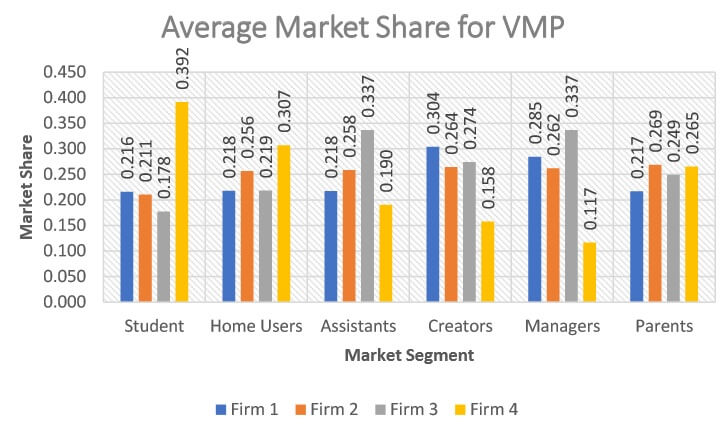
The graph above is the average market share for virtual meeting platform on the bases of the market segments. From the graph, it can be noticed that the firm is doing better in two out of six market segments compared to its competition. These two market segments are assistants and managers with an average market share of 0.337 each. Furthermore, by observing the graph, it canbe indicated that while it does not have the top market share firm 3 has also a decent average market share in creators segment. Though, the firm needs to be careful about firm 2 in that segment as there is only a .010 difference present. Therefore, the firm should focus on marketing and catering to these market segment needs and want slightly more. This is because it can get a better chance of revenue from these segments, while being ahead of the competition.
Conclusion
In conclusion, the report is created to understand the type of business of firm 3. The firm is a product-based company. The product that the firm provides to their customer is a best quality virtual meeting platform option. The objectives of the business were also mention. The analyses that were carried out wereindustry analysis and competitor analysis. In the industry analysis there was a look at the market share factors and the channel sales distribution for the virtual meeting platform and the digital vocal communicator. While the competitor analysis was conducted to understand which competingfirmis the biggest competition for firm 3.During the analysis, it could be observed that the firm does better sales in the hired assistants, high-tech managers, and professional creators. Moreover, the sales done via channel 1 seems to better option for the firm for period 7.
References
Anon, n.d. Microenvironment vs. Macroenvironment | Retail Management. [online] Courses.lumenlearning.com. Available at:
Mbithi, B., Muturi, W. and Rambo, C., 2017. Macro environment moderating Effects on Strategy and Performance. Haya: The Saudi Journal of Life Sciences, 2(5), pp.197-209.


