EGR120 EXCEL Assignment 3
Fins, or extended surfaces, commonly are used in a variety of engineering applications to enhance cooling. Consider an aluminum fin of constant rectangular cross section which are used to remove heat from a base where the temperature (Tbase) is 100 °C. The ambient temperature (Tambient) of the surrounding air is 20 °C. The temperature of the fin varies along its length. For long fins, the temperature distribution along the fin is given by the following:
T(x) - Tambient = (Tbase - Tambient)e-αx
where
α = √hp/KA (constant value for the fin once calculated for each value of the
thermal conductivity (k))
h = heat transfer coefficient (W/(m2-K)),
p = perimeter of the fin (m),
= 2*(a + b)
A = cross-sectional area of the fin at a distance x from the fin base (m2), and
= a*b
k = thermal conductivity of the fin material (W/(m-K)).
Perform the following:
1) Generate and plot the temperature distribution based on the distance from the base of the fin using the following:
- a = 0.05 m
- b = 0.01 m
- h = 12 W/m<sup>2</sup>
- k = 168, 84, and 42 W/(m-K).
The fin length is 0.1 m. The increments from the fin base at 0 m to the end of the fin at 0.1 m are 0.01 m. The cross-sectional area (A) of the fin is constant.
2) Generate a linear equation for each fin thermal conductivity based on the distance from the fin base used in part 1.
3) Use the linear equations in part 2 (for each fin thermal conductivity) to generate the temperature predictions (in ºC) as a function of distance from the fin base to the end of the fin, based on an increment of 0.0025 m. Compare the results from the analytical solution (Equation 1).
4) Using the data from part 1 (increments of 0.01 m) generate the temperature predictions (in ºC) as a function of distance from the fin base to the end of the fin, based on an increment of 0.0025 m, using linear interpolation. The data needs to be generated for each fin thermal conductivity.
5) Determine which method (linear interpolation (step 4) or linear equation (step 2)) best matches the analytical solution for all three thermal conductivities. What do you conclude from this comparison? Justify your response. To address this question you will need to repeat part 1 (without the plot) using a smaller increment in x (0.0025 m for this part, 0.01 for part 1).
Provide a paper copy of the results from EXCEL (both worksheet and plot) in your homework submission. Additionally send the *.xls (or *.xlxs) file to the instructor prior to the start of the class period when the homework is due. The EXCEL file should be called “HW3_ijk.xlsx” (or *.xls) where ijk are the initials of your name and m is the problem number.
The homework format provided should be used to document your solution to this problem.
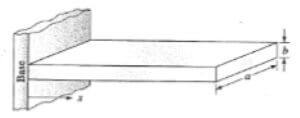
A diagram of the rectangular fin is in the following figure. The x coordinate has its origin at the base of the fin and is positive in the direction indicated in the figure. The base temperature (Tbase) is the temperature at the base of the fin, where x = 0. The ambient temperature (Tambient) is the temperature of the air around the fin and is what allows the fin to cool.
Figure – rectangular fin schematic.


