MRE5003 Industrial Techniques In Maintenance Management
Study Guide 3: CPM network analysis
Objectives of study guide 3
After completing this study guide, you will be able to:
- apply concepts of network analysis;
- compile and apply an Activity-on-Arrow network diagram;
- use Gantt charts for resource levelling and monitoring; and
- recognise the capabilities of project management software.
Contents of this study guide
- What is the point of activity schedules?
- What is the optimum frequency for preventative maintenance?
- Activity-on-Arrow networks
- Some definitions
- The critical path (or paths) through a network
- Action plan
- Example: Maintenance of a large industrial machine
- Gantt chart as an adjunct to critical path scheduling
- Resource allocation: The load histogram
- Network diagrams showing time-scales
- Computer packages for project management
- Further resources
1. What is the point of activity schedules?
If we are to be cost effective in the use of any limited resource, be it time, manpower or machines, we need to know precisely what has to be done and when it needs to be done. This requirement is true no less of maintenance planning, than of the planning of production runs or of construction projects. Maintenance projects are likely to be shorter in duration, but may be more intense in activity. The detailed jobs are more likely to be better estimated in duration and resources than for a building of unique or unusual design on a greenfield site.
The scheduling of work on a daily or weekly basis is also a key part of effective use of resources and we shall look at that later in this guide.
The chapter in your Reader by Leo Kennedy in the first edition of the late John Campbell’s UPTIME gives a good introduction to this topic. The 2006 edition has a different chapter, but it is generally similar.
The effects of incorrect or inadequate maintenance can be more costly than wastage by poor production. Specific figures for any country can of course only be rough estimates. For Australia alone, I read that in one year, maintenance expenditure was $7 billion while lost production due to downtime is $6 billion. A similar relativity would apply anywhere.
Let us start this study guide by reflecting on the philosophy of project management.
He who doesn’t plan to fail, Doesn’t fail to plan.
Think on your own experience. When you have had a clear goal for a single task, a deadline, and the required resources, you achieve the goal. Within most of us is the desire to perform, and the project management process gives us the required focus to do so. A major project is essentially a collation of separate smaller projects, each of course essential to successful overall completion.
I’d like to tell you of one of my experiences in Scouting. (Scouting is the largest youth movement in the world with some 27 million members in nearly every country). A long running tradition originating in the UK came to Australia from the 1950s: the Gang Show – a stage show of revue style. There are several such shows staged every year around the country. They are fast-moving, with perhaps 20 items with rapid scene changes, a mixture of sketch and musical, with a cast of Scout members that can number 100 or more. Rehearsals proceed over some months, and then the climax: the performances. (Forgive me if some of this sounds like publicity blurb: as you may have guessed, I have been involved both on and off stage in these shows!)
After the final performance one year, the Chief Commissioner spoke to the cast and crew and congratulated them on the excellent result: “Your enthusiasm was outstanding – go and apply it to your other Scouting activities”. Other activities comprise weekly meetings, and camps, hikes etc. and it is hard, if not impossible, to maintain in such routine activities every week the mini-crisis that a focus on a specific project, such as the Gang Show, gets. Do you see the parallel with project management and your weekly maintenance activities?
Does my simple example, and your experience in maintenance management, show up these features of a project in general:
- a defined purpose with a goal or goals clearly established?
- constraints in time and cost?
- resources of many kinds, usually across organisational boundaries?
- some element of risk?
- a once-off activity?
- phases in a life cycle?
- and, maybe, some surprises along the way!?
As a student in MRE5003, you will have had some contact with project management in your workplace, and the organisational arrangements will be mostly in place. So, in this unit, we will focus on only part of the total scope of the topic of project management.
Activity
The Project Management Institute has a thorough website (pmi.org and defines a project as a temporary endeavour undertaken to achieve a particular aim. A guide to the Project Management Body of Knowledge (PMBOK guide) is a classic source of information. Our Library holds a range of the many books on this topic. Whole units of study, and even master’s degrees, are devoted to it.
Activity
Try a web search to find and scan some current project management websites.
Activity
For further reading on this topic, the Library catalogue has this electronic text: Lester, A. (2003). Project planning and control, Butterworth-Heinemann. You should find it a useful addition to these study notes.
Also, if you haven’t already had a look at our extensive holdings of electronic journals, it is now time! Find the International Journal of Production Economics, and read closely the paper in Vol.29, Issue 2, pp.167-174, “Maintenance project management in the process industries: A look at the realities” by Pruett and Rinks (1993)
2. What is the optimum frequency for preventative maintenance?
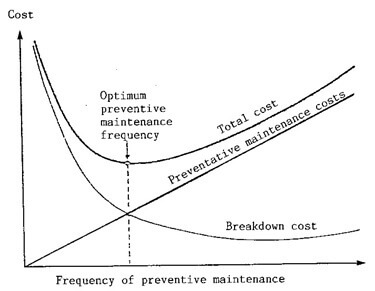
Figure 3.1
You will have seen diagrams as in Figure 3.1 applied to cost optimisation in general. It illustrates the point that the optimum preventative maintenance occurs at that frequency which minimizes the overall cost of maintenance and of breakdowns. Too little preventative maintenance produces excessive breakdown costs, too great prevents breakdown but becomes too expensive in its own right. It would of course be nice to have specific costs on such a diagram - would that they were available in all cases!
The scientific planning and scheduling of maintenance operations should reduce the cost of each maintenance task thereby either:
- enabling increased preventative maintenance at the same cost; or
- the same amount of preventative maintenance to be affected at a reduced cost.
Some techniques commonly employed to rationalise the equally desirable but always conflicting ambitions of the maintenance manager are:
- achieving minimum task completion time; compatible with
- optimum utilisation of available resources; and
- task completion at minimum overall cost.
To coordinate the disassembly and reassembly of a plant item for preventative or breakdown maintenance a schedule of activities is necessary. The maintenance master schedule explodes each list of activities into individual task with times, manpower and equipment resources allocated to each. Each task can then be considered individually for the allocation of time and resources. If labour or other resource scheduling poses a potential problem, specification of labour skills, manpower and resources associated with each task on the list of activities can also be considered to identify future periods of excess or weak demand for available resources.
In our study, we will start assuming that we have the activities to be performed, and that each has a scope of work and an estimate of the time and resources required. For a specific project, this is known as the WBS: the Work Breakdown Structure, a level-by-level breakdown to reach individual work packages. The number of levels will vary. For simple projects, Post-It™ pad sheets stuck on a board can help set this out. Where the project is a plant outage, it is likely that most of the activities will have been done before, so there will be expert knowledge, usually from people who have done the job before, or information from similar past jobs. Hopefully, such data would be available from your CMMS.
Maybe like me you have read, or heard at conferences, that the average “wrench time” of the maintenance workforce is as low as 30% of capacity? You can think of many factors that affect productivity in your workplace, some of which may be outside your control. However, much can surely be gained with better maintenance planning and control. This assumes that the RIGHT work is being performed, as it is possible to efficiently do work that can be shown to be unnecessary! This is considered in other units in this program: MRE5004 and MRE5006.
Work study is covered in another study guide in this unit.
3. Activity-on-Arrow networks
Showing the activities graphically enables their inter-relationships to be clearly seen. The best known network analysis methods originated independently in the 1950s: the Critical Path Method (CPM) and Program Evaluation and Review Technique (PERT). These are similar, except that:
- CPM uses a single time estimate for each activity (i.e. it is deterministic). Activities can be “crashed” at extra cost to obtain earlier completion;
- PERT helps to quantify the probability that a project can be complete by a set date (i.e. it is probabilistic).
These give a comprehensive practical system for controlling planning and controlling projects in many fields. The primary aim is to program and monitor the progress of a project so as to complete it in minimum time. Let us now outline and exemplify the methods.
3.1 Basic concepts
A major project consists of many separate activities. While the timing of some of these activities is critical, a certain amount of delay in some of them can be allowed without affecting the overall completion time. The critical path method helps to pinpoint the critical activities and to compute the amount of spare time or “float” available for the non-critical ones.
Advantages of the procedure
- The planner is compelled to plan the job logically.
- The resulting network provides a clear graphical layout of the project.
- The critical path can be traced through the network. This path is formed by the longest sequence of critical activities. The critical path is shortest time in which the whole job can be finished.
Preparation
- Define the scope and purpose of the project.
- Identify the ‘activities’: individual tasks of which the project consists.
- Determine the logical relationship between activities and events. (Events represent the start or end of individual activities). This allows the network diagram to be drawn.
- Determine for each activity the estimated duration, resources, possible restrictions, etc.
Analysis
- Examination of the network to find which jobs are important in determining total project time, hence determining the critical path.
- Detailed breakdown of time characteristics of all activities.
Control
If delays are experienced, determining whether they are critical and, if so, taking action to make up time.
3.2 Drawing an Activity-on-Arrow network
We will first consider the Activity-on-Arrow (i.e. A-O-A) method of showing a network. Each activity in the network is represented by an arrow (and usually a letter denoting which activity is involved) as in Figure 3.3.
The steps shown in this text.
A

Figure 3.2
An event is a point in time, shown by a node on the network, and represents the start or end of each activity. The start of an activity is called the tail event, and the finish, a head event. Events are shown by a circle with an identifying number as in Figure 3.3. Sequential numbers are recommended.

An activity is uniquely identified by the pair of numbers belonging to the two events which it links. In Figure 3.3, the activity A shown is therefore 1-2. Activities link tail events, commonly designated “i” and head events, designated “j”.
Certain activities must be completed before others can begin, whilst certain groups of activities can be carried out concurrently. Now consider the small network below in Figure 3.4:
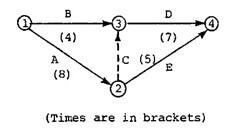
Figure 3.4
Activities D (i.e. 3-4) and E (i.e. 2-4) cannot commence until A (i.e. 1-2) is complete. Activities A and B can be carried out concurrently. More precisely, D requires the completion of both A and B, where E depends only on the completion of activity A.
A DUMMY activity is necessary to indicate the precise logical dependence of the activities in the network. These have no duration, and are marked as a dotted line: here C.
A common situation in which dummies occur is when two activities have the same head and tail event. Fig 3.5 is another simple network that shows this,
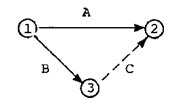
Figure 3.5
by introducing the dummy event C to alleviate the situation, wherein both activities A and B would be identified by the same pair of event numbers 1-3.

Figure 3.6
In network diagrams arrows simply show relationships between activities: their lengths have no particular significance. Time flows from left to right.
If a number of activities are in series, and apart from the starting and finishing activities, each one does not depend on nor affect another outside the series, they can be shown as a hammock. This subset of activities is effectively a mini-project running alongside the main project and can simplify network diagrams, as well as helping segregate costs if the hammock is run by another department or group.
The minimum duration for the sequence of all four activities in Figure 3.4 is 15 time units.
This is because the dummy activity C indicates that D cannot commence until A (as well as
- B) is complete. So the path which controls the earliest completion (1 3 4) is the
CRITICAL PATH.
Activity
Mark this on Figure 3.4 with a highlighter pen.
Any change in duration of activities A and D will change the total project time. On the other hand, you should be able to see in Figure 3.4 that activity B could be delayed by as much as 8 minus 4, i.e. 4 time units, without causing any delay in the project (i.e. before it becomes critical). For activity B then, 4 time units is the total float. We will examine this and related concepts in more detail soon.
Correct relationships and inter-dependencies are established by analysing each activity:
- What activity or activities can immediately precede the activity in question?
- What activities can be done concurrently?
- What activity or activities can follow?
3.3 The rules
Dependency rule
An activity which depends upon another is shown to emerge from the head event (i.e. the finish) of the activity upon which it depends, and only dependent activities are drawn in this way,
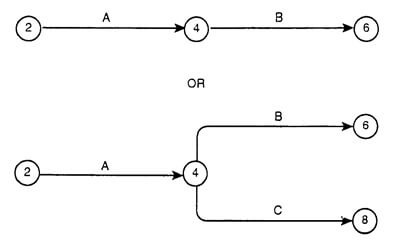
Figure 3.7
Event 6 cannot occur until all activities leading into it are complete.
Multiple starts and finishes
These usually arise when some activities are entirely independent of the control of the network user. Wherever possible, these multiple starts/finishes should be linked to the network by activity arrows, giving the desirable estimated or necessary time relationship between the “free” event and the rest of the network.
Merge and burst modes
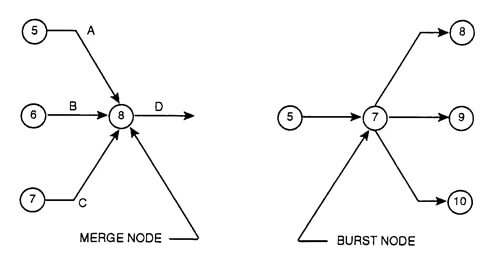
Figure 3.8
No activity can start until its tail event is reached, e.g. D cannot commence until A, B and C are completed.
No looping
Activity E in Figure 3.9 is wrong. Work must flow consistently from left to right.
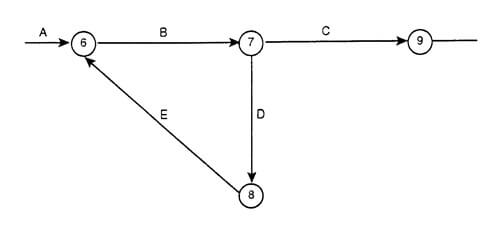
Figure 3.9
No dangling
The only event that can have no following activity is the completion of the project.
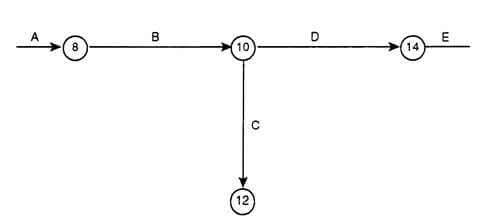
Figure 3.10
Overlapping activities
Consider the following two simple activities (from the pencil and tracing days of drafting):

Figure 3.11
The diagram implies that all the pencil sketches must be finished before any tracings can be produced. But tracings may possibly be commenced when a few sketches are completed. This can be achieved by breaking the activities into two sections as in Figure 3.12:
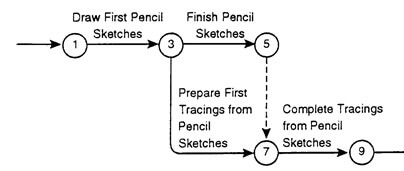
Figure 3.12
The network shows that it is not possible to complete all the tracings until all the sketches have been completed (dummy), but at the same time the preparation of some tracings may proceed as soon as the initial sketches have been completed.
Suppose it is desired to take prints off the tracings as soon as a few are finished, but the printing cannot be completed until all tracings are completed. These requirements can be added to the network as follows:
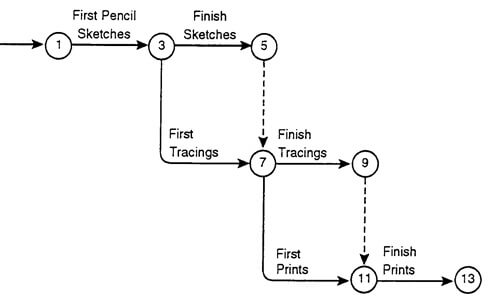
Figure 3.13
4. Some definitions
When projects run according to plan, all events will occur as early as made possible by the activities before them. D = Duration, in days, weeks, etc.
4.1 Earliest time of an event (EET)
EETi = earliest time at which event i can occur.
4.2 Latest time for an event (LET)
LETj = latest time at which event j can occur without delaying the project.
For the critical path, EETk = LETk ES = EF, LS = LF
To calculate earliest times for events, start at the first event. This will have EET = 0. For successive activities, EET will be the maximum of the completion times for all preceding activities:
EETj =max EETi +dij i
means
EET for j = maximum (EET for i + duration of activity i – j) over all i.
Similarly, to calculate LET, start at the end node and work backwards. Then:
LETi = min LETj – dij j
4.3 The earliest start time
The earliest start time is the earliest possible time at which an activity can start and is given by the earliest time of the start event.
ES = EET (tail event) or EETi
4.4 The earliest finish time
The earliest finish time is the earliest possible time at which an activity can finish and is found by adding the duration time to the earliest start time.
EF = EET (tail) + D
Note: In calculating earliest times work from the start of the network.
4.5 The latest finish time
The latest finish time is the latest time by which an activity can finish without extending the project and is found by taking the latest event time of the end event.
LF = LET (head event)
Note: In calculating latest times work from the end of the network.
4.6 The latest start time
The latest start time is the latest possible time by which an activity can start without extending the project and is found by subtracting the duration time from the latest finish time.
LS = LET (head) – D = LF – D
4.7 Float or slack
The time by which an activity can expand without delaying any subsequent activity on the critical path. Picher’s definition is (“…the leeway which the activity has and can be used without affecting the overall duration of the project. A variety of types of float can be derived, but Total Float is by far the most important and useful. Three other types … mainly proved to be of only academic interest in development of the use of networks”
Total float is the latest start date of an activity minus earliest start date of the activity.
TFij = | LS – ES | ||
or, | TFij = | LETj – EETi- dij | (where i = tail event, j = head event, as before) |
Free float
The time by which an activity can expand without delaying the earliest start of any (critical/non critical) following activity.
Free float is the earliest date of succeeding event minus earliest finish date of activity.
FF = EET (head) – EET (tail) – D
For successive Activities A and B (as shown):
A B

Figure 3.14
Free float on Activity A is:
FFA = ESB – ESA – dA
= EETj – EETi – dij dij =dA
Independent float
The time by which an activity can expand without affecting any other activity either before or after.
Independent float is the earliest date of succeeding event minus the latest date of preceding event minus activity duration.
IF = EET (head) – LET (tail) – D
Negative float
The time by which an activity must be reduced for the project to meet a target date.
Summarising:
Abbreviation | Definition | Meaning | Calculation |
ES | Earliest Start Time | The earliest time that an activity can start. | Time is zero at the start of the project |
LS | Latest Start time | The latest time that an activity can start without delaying the completion of the project. Subtract the duration from the LF time. | LF – D |
EF | Earliest Finish time | The earliest time an activity can be finished – add the duration to the ES time. In calculating these, work from the start of the network. | ES + D |
LF | Latest Finish time | The latest time an activity can be finished without delaying the completion of the project. In calculating these, work from the end of the network. | LS + D |
Note: for activities on the critical path, ES = LS and EF = LF | |||
Float or slack – shows the available flexibility in scheduling an activity.
TF | Total Float | The time by which an activity can be delayed or extended without delaying any following activity on the critical path. | LS – ES or LF – EF or LF – ES – D |
FF | Free Float | The time by which an activity can extend and without delaying the earliest start of any following activity, critical or non-critical. | EF – ES – D (see also earlier) |
IF | Independent Float | The time by which an activity can extend and without affecting any other activity, before or after it. | EF – LS – D |
NF | Negative Float | The duration by which an activity must be reduced for the project to meet a target date. |
5. The critical path (or paths) through a network
To recap, the critical path (or paths) through a network lies along those activities:
- whose ES = LS and EF = LF
- whose durations equal the difference between Start and Finish times.
6. Action plan
An action plan contains all the information we need. The list of all activities that must be done to complete the specified project should have the times each is expected to take, any non-routine resources that will be used by the activity, and the predecessor activities for each one. Such information could be shown in a table headed such as:
Objective:
Measure of performance: Constraints:
Tasks Precedence Time Cost Responsibility
7. Example: Maintenance of a large industrial machine
Ref: Study Guide 3.
The table below shows the activities required for the routine maintenance overhaul of a large item of plant. They are listed in sequential order, together with their estimated durations in days. From a knowledge of the sequence of events, the logical order can be shown by the activity codes added.
Activities | Days | |
1–4 | Dismantle, clean and check mechanical parts | 12 |
1–3 | Dismantle and clean electrical systems | 7 |
1–2 | Dismantle hydraulics | 5 |
3–5 | Test electrical components | 10 |
3–6 | Test hydraulic components | 7 |
5–7 | Order replacement parts | 10 |
5–8 | Repaint components | 4 |
6–8 | Repair serviceable parts | 12 |
8–10 | Check and assemble replacement parts | 5 |
8–9 | Check and assemble serviceable parts | 6 |
9–10 | Fit and assemble mechanical components | 2 |
10–12 | Rebuild and test complete machine | 6 |
6–11 | Notice to plant inspector | 2 |
11–12 | Issue of new operating licence |
2 |
The activities can now be drawn as a network. Start with an event node 1, and you could label it START.
Draw three arrows from here, 1–2, 1–3, 1–4, and label them with their durations. Activities 3–5, 3–6 follow 1–3, so draw them in, and so on. Add dummies where needed to show precedence.
Look through each activity in the list and locate its arrow:
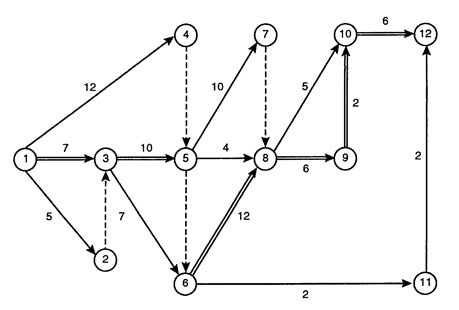
Figure 3.14: Example Network Diagram
7.1 Analysis of the network
To calculate the earliest and latest event times, follow these steps:
- start from the left of the network diagram, the tail of the first activity;
- call this time 0 (this does not imply that activities emerging from here necessarily start at time 0);
- proceed to each event calculating the earliest time at which it can occur.
It is essential to understand that if several activities lead to an event, the earliest time is fixed by the longest chain; i.e. the earliest time for example at which 5 can occur is time 17. Chains
1 4 5 (duration 12) also lead to 5, but clearly the earliest time that one can reach event 5
(i.e. with all activities leading into event 5 can be completed) is 17 days;
- list all these earliest times:
Event No | Earliest Event Time |
|
1 2 3 4 5 6 7 8 9 10 11 12 |
0 5 7 12 17 17 27 29 35 37 19 43 |
Thus the earliest time for event 12 – i.e. completion – is 43 days; this is the expected total project time;
- the latest event times (and the critical path) are found by executing a backward pass over the network diagram:
- start from the right - the last event;
- give this event its earliest time (here 43). By subtracting durations calculate the latest possible occurrence time for any event from final time 43. As before the latest event time is fixed by the longest chain form the right. For example, event 5, some chains are:
Time | Event Time (43 minus time) | |
|
5 6 11 12 5 6 8 10 12 5 6 8 9 10 12 5 8 10 12 5 7 8 10 12 5 7 8 9 10 12 |
4 23 26 15 21 24 |
39 20 17* 28 22 19 |
so that the latest event time for 5 is 17 days (i.e. the LF for 3-5, and 4-5). We list these latest event times, and then mark these on the diagram;
Event | times | |
Event No | Earliest (as before) | Latest |
|
1 2 3 4 5 6 7 8 9 10 11 12 |
0 5 7 12 17 17 27 29 35 37 19 43 |
0 7 7* 17 17* 17* 29 29* 35* 37* 41 43* |
- the critical path lies along those *activities whose earliest and latest times for the tail events and for the head events are the same and whose durations equal the difference between head and tail event times. (It can be more than just the one critical path in a project);
- the earliest and latest event times should now be put on the network diagram. Figure 3.15 illustrates the designation system introduced earlier, with the 3-letter acronym system that some find easier to grasp. Other graphical networks styles are also used, such as the Activity-on-Node or a development of it – the Precedence diagram (see Study Guide 4) – where the key data for each activity are shown in rectangular nodes and defined in an accompanying legend. Two ways I have seen are shown at the right side of Figure 3.15:
LS | ES | EF | ||
Activity description Number | TF | Activity No. | D | |
D | LS | LF | ||

Figure 3.15
Then, to recap our discussion, for the activity i – j:
- earliest start time ES or EETi
- latest start time LS = LF - D or LETj – D
- earliest finish time EF = ES + D or EETi + D
- latest finish time LF = LETj
- total float TF = (LF – EF): the amount of time an activity can be delayed without delaying the overall project completion time
- free float FFa = (Minimum ES for any following activities - EETa – Da): the amount by which any activity can expand without interfering with the commencement of any subsequent activities. If there is no following activity (i.e. completion has been reached) the project duration is the minimum ES of following activities;
- independent or interfering float IF = (ES - LS - D): the amount by which an activity can expand without affecting any other activity either before or after.
The network is now shown in Figure 3.16 with the earliest and latest event times shown for each event, above and below the node respectively.
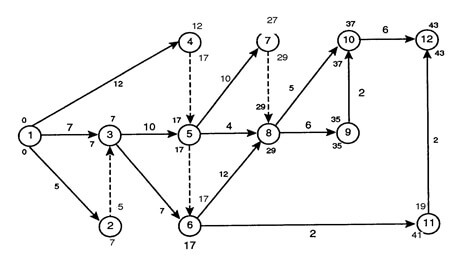
Figure 3.16
A reasonably full analysis of the network would be:
Activity | Duration | Start Times | Finish Times | Total Float | ||
ES | LS | EF | LF | Total | ||
|
1–2 1–3* 1–4 3–5* 3–6 5–7 5–8 6–8* 6–11 8–9* 8–10 9–10* 10–12* 11–12 |
5 7 12 10 7 10 4 12 2 6 5 2 6 2 |
0 0 0 7 7 17 17 17 17 29 29 35 37 19 |
2 0 5 7 10 19 25 17 39 29 32 35 37 41 |
5 7 12 17 14 27 21 29 19 35 34 37 43 21 |
7 7 17 17 17 29 29 29 41 35 37 37 43 43 |
2 0 5 0 3 2 8 0 22 0 3 0 0 22 |
*Critical Activities: those which have no float – they form the critical path.
Activity
Highlight the critical path on Figure 3.16.
8. Gantt chart as an adjunct to critical path scheduling
The well-known Gantt chart is possibly the simplest of all graphical devices where a progressive list of activities from start to completion can be shown diagrammatically against a time base. This chart therefore provides a means of monitoring the progress of activities in relation to the actual project time.
It is a very useful tool upon which to schedule, against time, a small number of sequential and partially sequential activities. A framework is drawn up which lists activities from top to bottom in ordered sequence and gives time flowing from left to right. The time which an activity should take is represented by a horizontal line or bar whose length is proportional to the time taken.
The simple bar chart can in fact be developed into a relatively sophisticated planning tool by the introduction of:
- available time into which activities may be expanded without delaying following activities or overall job completion;
- actual progress made on activity tasks are compared with planned progress after nominated time from the job commencement;
- allocation of resources to each task and to overall job at nominated times.
8.1 Example
The activities involved in a simple maintenance job are shown in the table and network of Figure 3.18.
Activity No | Duration (days) | Manpower Requirements |
1-2 | 1 | 3 |
1-3 | 3 | 2 |
2-4 | 2 | 3 |
2-5 | 3 | 5 |
3-4 | 4 | 3 |
4-5 | 3 | 1 |
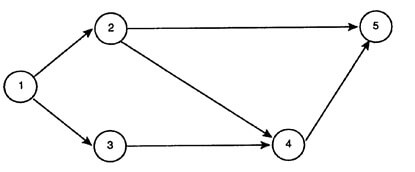
Figure 3.18
- What is the critical path through the job and what is the minimum completion time?
- Determine the total and free floats for each activity.
8.2 Solution
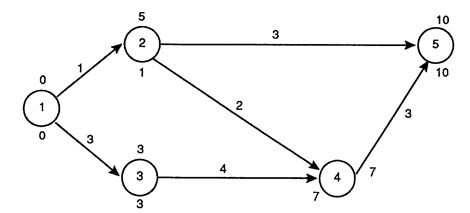
Figure 3.19
Activity No | D Days | ES | EF = ES + D | LS | LF = LS + D | TF = LF – EF | FF | IF = TF – FF |
1 - 2 | 1 | 0 | 1 | 4 | 5 | 4 | 0 | 4 |
1 - 3 | 3 | 0 | 3 | 0 | 3 | 0 | 0 | 0 |
2 - 4 | 2 | 1 | 3 | 5 | 7 | 4 | 4 | 0 |
2 - 5 | 3 | 1 | 4 | 7 | 10 | 6 | 6 | 0 |
3 - 4 | 4 | 3 | 7 | 3 | 7 | 0 | 0 | 0 |
4 - 5 | 3 | 7 | 10 | 7 | 10 | 0 | 0 | 0 |
D = Duration ES = Earlier Start time | EF = Earliest Finish time |
LS = Latest Start time LF = Latest Finish time | TF = Total Float |
FF = Free Float (EF – ES succeeding activities) | IF = Independent Float |
Self-Assessment Activity Mark the critical path through the network. What is the work duration? [ ________ days]. | |
8.3 Construction of Gantt chart for this example
Step 1
Construct a chart framework with a time scale along the top and activities down the left hand side in order of increasing tail numbers (i.e. the start of each activity). Where two or more activities have the same tail number, arrange them in order of increasing head numbers, e.g. activities 1-2, 1-3 and also 2-4, 2-5. See Figure 3.20 which is “Schedule A”.
Step 2
Set off the first activity on the list putting its left hand end on the 0 time scale. Mark the tail and head numbers at the beginning and end of the bar.
Step 3
Set off the second activity aligning the tail number with the head number of the previous activity if these numbers are the same. If not, then align the tail number with the preceding head number with which it coincides.
Step 4
Repeat 2 and 3 for all activities, aligning tail numbers with previous head numbers where possible, or alternatively with previous head numbers.
Note: A simple rule for drawing the chart is, “match the tail number with the same number which is farthest to the right”.
Dummies must be included as a single upright line.
The diagram should be something like Figure 3.20. The boxes represent project activities scheduled at earliest start times, while total float is indicated by the arrow line to the right.
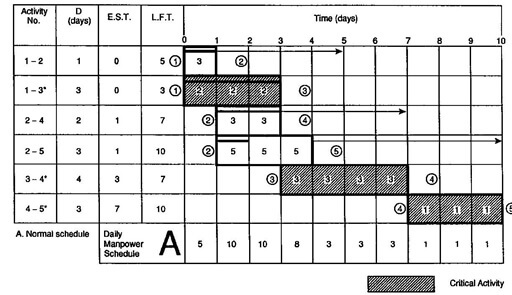
Figure 3.20
Activity
If you have access to Microsoft Project or another software package, try using it to set out a Gantt chart for the above example data. In MSProject, start by entering an “task” named “START”, and give it a duration of 0 days. Choose and enter a date.
Enter each succeeding activity and its duration, and its predecessors.
MSProject adds a WBS number for each one. And progressively compiles the matching AON network and Gant chart. When all are entered, add “FINISH”, again with 0 days. (Note that the default is a 5-day working week.)
8.4 Gantt chart analysis
To show how work is actually progressing a bar is drawn within the activity area, the length of the bar representing the amount of work completed as each time unit of the project is completed.
Examine Figure 3.20 above at day 5.
- Activities 1-2, 1-3, and 2-4 are completed.
- Activity 2-5 has started, is 2 days behind, but has 6 days float and therefore is not yet critical.
- Activity 3-4 has not started and is 2 days late. This is a critical activity and action must be taken to make up the time or the project completion will be delayed.
Float
Activity 1-2 can move to the right by 4 days without delaying job completion on day 10, but delay of activity 1-2 will delay the start of non-critical activity 2-4:
i.e. Activity 1-2 has 0 Free float; Activity 1-2 has 4 days Total float.
Activities 1-3, 3-4 and 4-5 are on the critical path and have no float.
Activity 2-4 can move 4 days to the right without delaying the start of any other activity:
i.e. Activity 2-4 has 4 days Free Float; Activity 2-4 has 4 days Total Float.
Activity 2-5 can move 6 days to the right without delaying any other activity or the job completion: see this marked up in Figure 3.21:
i.e. Activity 2-5 has 6 days Free Float; Activity 2-5 has 6 days Total Float.
9. Resource allocation: The load histogram
The Critical Path Method arranges the sequence of jobs assuming that time is the most important factor and in some cases this is so. However, probably in most instances the maximum number of people who can be employed and the special equipment used may impose severe restrictions.
The same principles apply to the daily scheduling of maintenance jobs that may, or may not, be related to each other. The task is generally simpler for jobs that are mutually exclusive, i.e. do not rely on interactions with other jobs.
‘Loading’ is the term given to the assignment of work to an operator, machine or department. On any particular jog there is generally a maximum quantity of both labour and machines available for use. Analysis using CPM may reveal a demand for labour in excess of the maximum available for a short period and then later on the demand drops to well below the maximum. By the utilisation of float, activities can be scheduled either earlier or later to “smooth out” the unevenness in labour and/or machine demand. This is termed “smoothing the load” or “resource levelling”.
Reader item by Picher, “Planning for construction - the allocation of resources”. This Chapter 10 extract from the last edition of the classic book, Principles of construction management, although predating current computer application, remains an excellent text in explaining the background. Pilcher explains how to allocate activities so that the job is still completed in the shortest time possible. In maintenance, resources are often (usually?) limited, and then the job must be extended to suit.
9.1 Example continued: Return to our maintenance job
Assuming:
- no specialist labour skills required for any activity;
- continuous progression of activities;
- constant rates of working;
- all activities commencing at their ES;
… we will determine the daily manpower requirements for the project. The same general process of resource levelling can be followed for non-project maintenance jobs. With the usual case of a fixed number of people and range of trades skills, the jobs need to be ranked in priority of importance to the business, and the available people so assigned. Compared with projects, the scope of maintenance jobs and the estimated times will probably be better known and many will have been done before. The degree of finesse in estimated times will vary with the type of plant and jobs, but in a large plant, you are doing well if you can get to within 2 hour blocks.
The daily manpower requirements in both cases can be determined with the aid of the Gantt chart (Figure 3.20). The boxes represent project activities scheduled at earliest start times, while total float is indicated by an arrow to the right. For non-project work, a column could be included for the names of the workers.
In our project example, Schedule A in Figure 3.20, is based on scheduling all activities to start at the EST. Daily manpower requirements fluctuate from 1 to 11 as shown in the bottom row of the chart.
Activity
Plot the number of workers in Schedule A (Figure 3.20) against days as a histogram to show more graphically the unevenness of resource use.
We can use our Gantt chart to “level” this fluctuating labour demand. If we assume that 1 man working for 3 days can achieve what 3 men achieve in 1 day, activity 1-2 can be expanded within its available float across days 0, 1 and 3. This is possible because 1-2 is not critical activity.
If we examine activity 2-5, this can be re-scheduled on the last three days of its available float (days 8, 9 and 10). Activity 2-5 is now critical, however.
In this way the manpower loading is scheduled as per daily “Schedule B” in Figure 3.21.
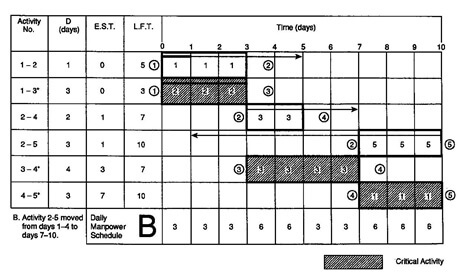
Figure 3.21: Revised Scheduling to reduce Peak in Resources
If we now break up activity 2-5 and reschedule activities 2-4 and 2-5 over longer periods than our original plan, we complete 15 man days over day 5 to 10 as shown in Figure 3.22, daily manpower “Schedule C” is created.
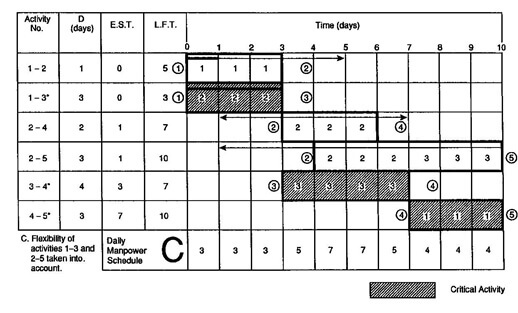
Figure 3.22: Further Revised Scheduling
Resource allocation is probably the central factor in:
- deciding the exact program of start to finish for non-critical activities; and
- deciding whether the critical activities should be scheduled at other than Earliest Start Times.
10. Network diagrams showing time-scales
Gantt charts give a better visual report of progress, but do not show interdependent relationships between activities, nor float. However, when backed with a network analysis, float is shown after the activity durations and vertical link line can be added to show constraints between activities. Figure 3.23 shows a typical example.
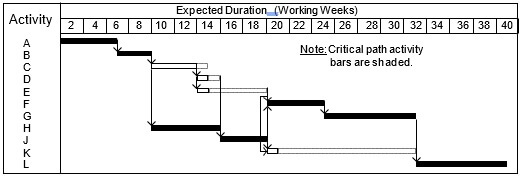
Figure 3.23: Sample Gantt Chart built from CPM/PERT Analysis
Another way of showing the critical path and other paths with a time scale is shown in Figure 3.24. This “AOA” presentation is a blend of the project logic, durations of activities and information on the schedule. Figure 3.24 gives the equivalent time-scale network diagram to the Gantt chart shown in Figure 3.23. Which format would you prefer for monitoring a project?
2 | 4 | 6 | 8 | 10 | 12 | 14 | 16 | 18 | 20 | 22 | 24 | 26 | 28 | 30 | 32 | 34 | 36 | 38 | 40 |
Expected Duration (Working Weeks)
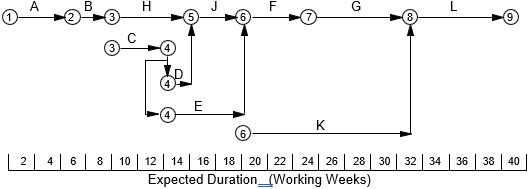
Figure 3.24: Time Scaled Network Diagram for Project in Figure 3.23
11. Computer packages for project management
Powerful computer software is available and commonly used for all but the most simple projects. MSProject™ is the most widely used, with Primavera™ probably second. In this unit, we look at what is behind such software, rather than the specifics of how to use any particular package. Such packages draw on all the methods we cover.
If you work in maintenance planning, you will obviously need to become competent with whatever software you have in your workplace.
I was interested to hear the founder of a major consulting firm say that although they had 3000 staff and handled 35 000 projects each year, he felt that EXCEL was enough for nearly all of them.
It is worth noting this comment from Meredith and Mantel (2002). Project management A managerial approach, 5th edition, Wiley, which must be one of most valuable books on this subject:
“There is of course the danger that human nature, operating in its normal discreet mode, will shift the task of learning project management to that of learning project management software. Projects have often failed because the project manager started managing the software instead of the project”.
The thinking part of network construction is the drawing of the network: the computer’s best role is doing the calculations.
Activity
Do a web search and/or visit some of the sites on available software in project management.
12. Further resources
www.eh.com.au www.associate.com/gantt (to set up a free online Gantt chart)
Check the Library electronic journals for the International journal of production economics, Vol.29, pp.167-174, 1993, for an important paper worth reading: Pruett, J.M. and Rinks, D.B. Maintenance project management in the process industries: a look at the realities.
Levitt, Joel (2004). Managing maintenance shutdowns and outages [electronic resource], Industrial Press Inc, can be read online via the Library catalogue. I think Chapters 15 and 16 are particularly good.
Activity
At the end of the Pilcher extract in your Reader, there are some problems that you could try: 10.1 to 10.5.
In our next study guide, we shall look at further applications of network planning and PERT, and in the one after that, examine application to the planning of major plant shutdowns.

